
Research projects · three methods
Research examples that test a finding before it informs a decision.
These public-data studies answer different questions, so each one needs a different test. The comparison keeps the source, evaluation method, intended decision and uncertainty beside each result.
Compare the three methodsThree questions · three evidence routes
Description, prediction and model selection require different evidence.
- Studies
- 3
- Verified sources
- 5
- Files available to inspect
- 17
Evidence register
Compare the research question before comparing the result.
Every cell below is tied to a Project, an attributed source and a retained analytical result.
Evidence dimensionDescriptive studyPredictive studyModel-selection study
Research questionWhich one-kilometre areas should a highways engineer inspect first, and what should be checked at the location?Which selected stations need a closer operational check before a planner changes a rebalancing or staffing plan?Across six chronological origins, does either the R or Python correction improve the published half-hour demand forecast consistently enough for further review?
Public sourceDepartment for Transport final collision, vehicle and casualty recordsTen official TfL Santander Cycles journey extractsNESO Day Ahead Half Hourly Demand Forecast Performance
Retained period1 Jan 2020–31 Dec 20241 Jan 2026–31 May 20261 Apr 2021–12 Aug 2026
MethodTyped collision, vehicle and casualty facts; adjusted-severity trends; transparent one-kilometre ordering; one retained collision trace.Complete station-hours; leakage-safe one, three and six-hour features; three expanding rolling origins; weekly, Poisson and boosted-quantile comparisons.Checksum-locked source; issue-time feature contract; six 28-day rolling origins; the same published, base-R and Python forecasts at every origin; one fixed review test.
Evaluation14 checks pass, 1 coordinate-coverage warning retained and 0 blocking failures.26,784 held-out May forecasts; 20.8% aggregate MAE improvement over the weekly baseline; 88.8% retained interval coverage.8,066 held-out forecasts; R improves MAE by 2.14% and clears the review test; Python improves MAE by 0.71% and does not.
Decision useNarrow an engineering site inspection and frame the junction, crossing and night-time sightline questions.Flag a station for live availability, nearby-dock and operating-constraint review before a service plan changes.Keep the published forecast as the operating reference, advance R for further controlled comparison and hold Python at the selection test.
Uncertainty and limitPolice-reported injury collisions are incomplete and the ordering is not exposure-adjusted, causal or a road-safety risk score.Completed hires omit unmet demand, historic bike stock and rebalancing actions; the result is historical evaluation, not deployed or autonomous operation.The retrospective study omits operational weather, embedded generation, events and live system conditions; it neither reproduces NESO’s method nor directs system operation.
01Descriptive study
Road Collision Trends and Engineering Review
Turn reported collision records into a bounded inspection question.
Which one-kilometre areas should a highways engineer inspect first, and what should be checked at the location?
Open Road Collision Trends and Engineering Review- Collisions processed
- 503,475
- Casualties processed
- 640,522
- Review cells
- 65,242
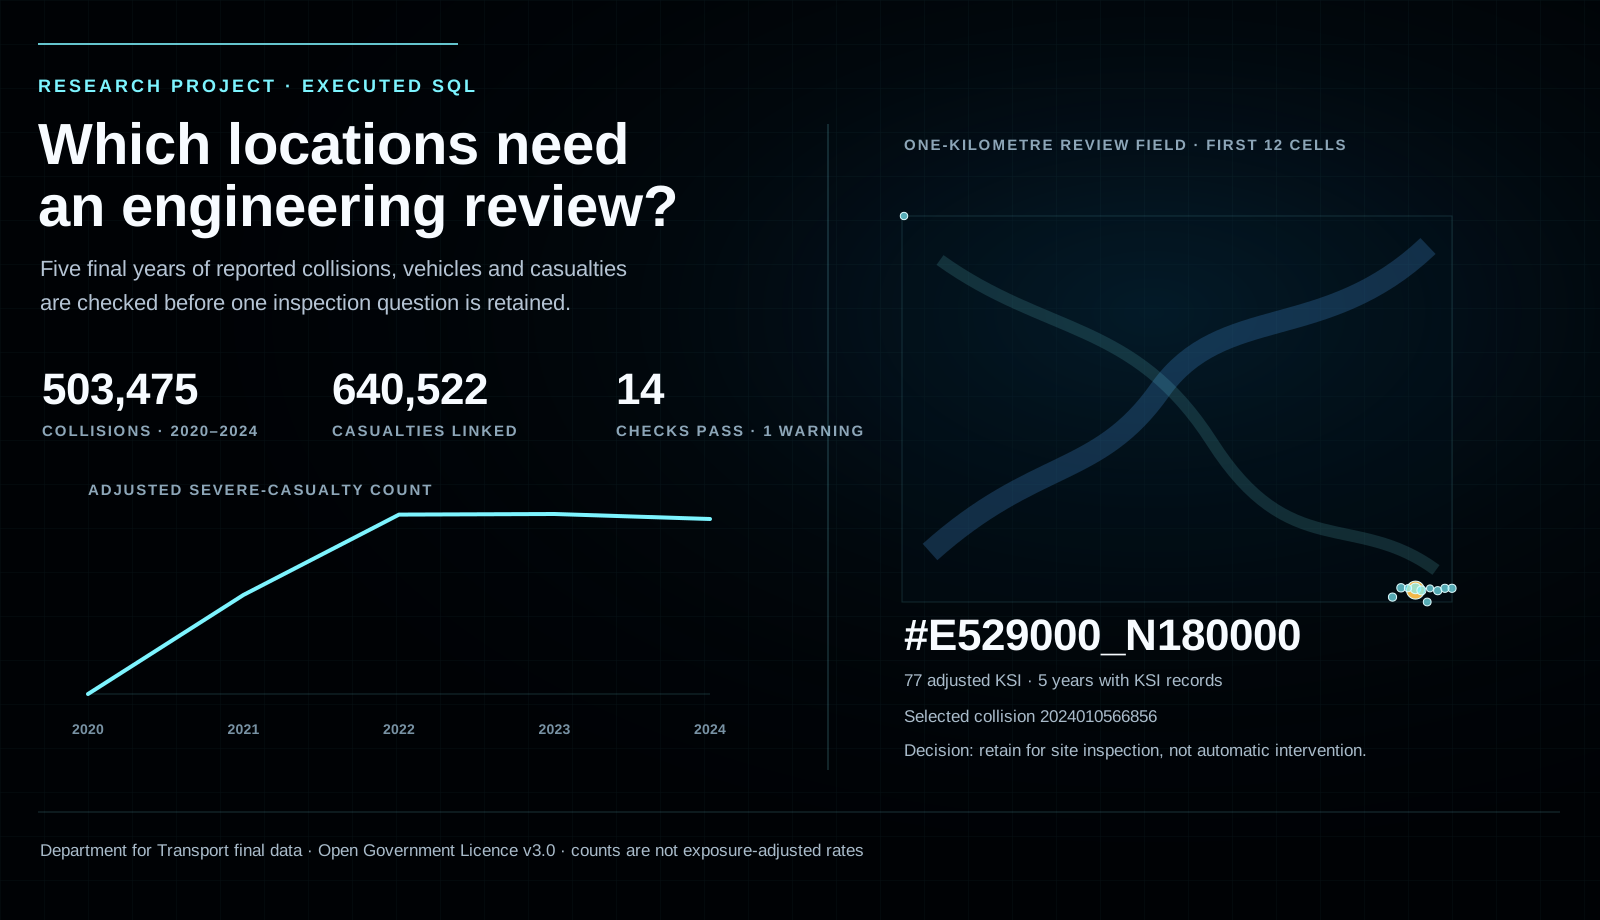
One retained trace
From collision record to site question.
- 01Reported record
2024010566856
- 02Observed detail
4 casualties · 1 vehicle · 20 mph
- 03Inspection cell
E529000_N180000
- 04Human boundary
Retain the cell for inspection and ask a highways engineer to review the multi-arm junction, crossing paths and night-time sightlines.
Quanta Meridian built the SQL model and analysis from public Department for Transport records. The data does not represent client work.
02Predictive study
Cycle Hire Demand and Service Planning
Test station-demand forecasts before they enter service planning.
Which selected stations need a closer operational check before a planner changes a rebalancing or staffing plan?
Open Cycle Hire Demand and Service Planning- Journeys inspected
- 3,563,266
- Station-hours
- 41,460
- Held-out forecasts
- 26,784
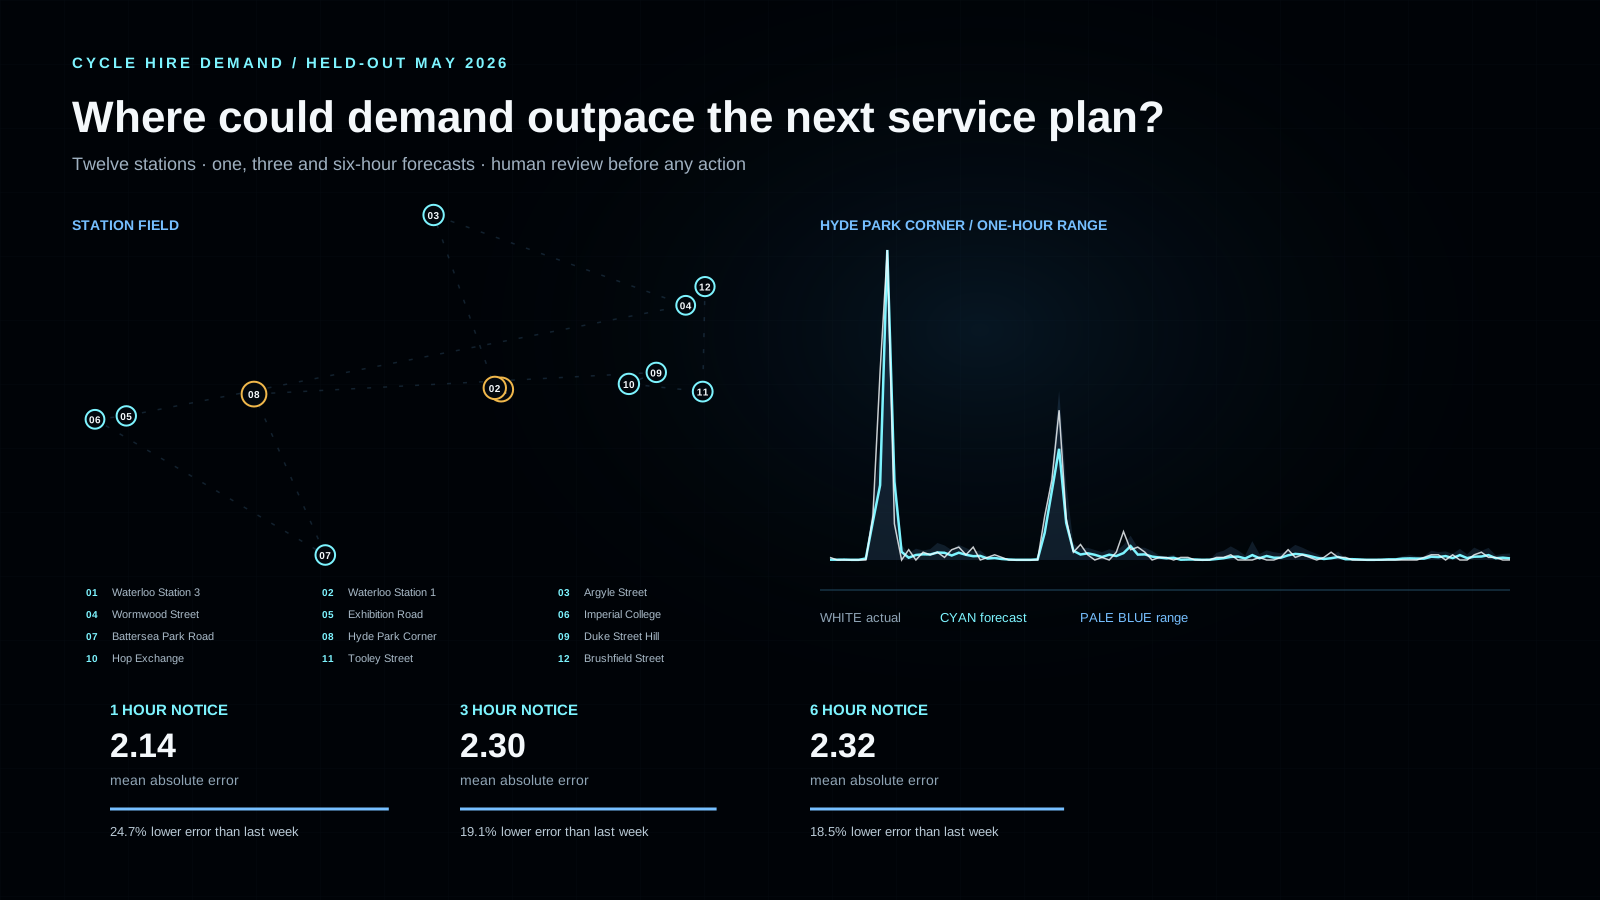
One retained trace
From station-hour to planner check.
- 01station-hour observation
Waterloo Station 3, Waterloo · 152 departures · Counted from unique TfL journey numbers
- 02forecast issue
Waterloo Station 3, Waterloo · 2026-05-13 06:00:00+00:00 · Only earlier observations available
- 03168-hour seasonal lag
Waterloo Station 3, Waterloo · 108 · Same station and hour one week earlier
- 04selected forecast
Waterloo Station 3, Waterloo · 161.3 · 80% interval 0.0 to 169.3
- 05error review
Waterloo Station 3, Waterloo · 9.3 hires · Flagged for station-day review
- 06planner action
Waterloo Station 3, Waterloo · Human review required · Check live availability, nearby docks and operating constraints before intervention
Powered by TfL Open Data under the Transport Data Service Licence. Quanta Meridian processed ten official 2026 journey extracts into a fixed historical research subset; no client or live operating data is used.
03Model-selection study
Day-ahead Electricity Demand Forecast Review
Choose whether the published curve or a challenger deserves the next controlled test.
Across six chronological origins, does either the R or Python correction improve the published half-hour demand forecast consistently enough for further review?
Open Day-ahead Electricity Demand Forecast Review- Source rows checked
- 94,050
- Held-out forecasts
- 8,066
- R MAE improvement
- 2.14%
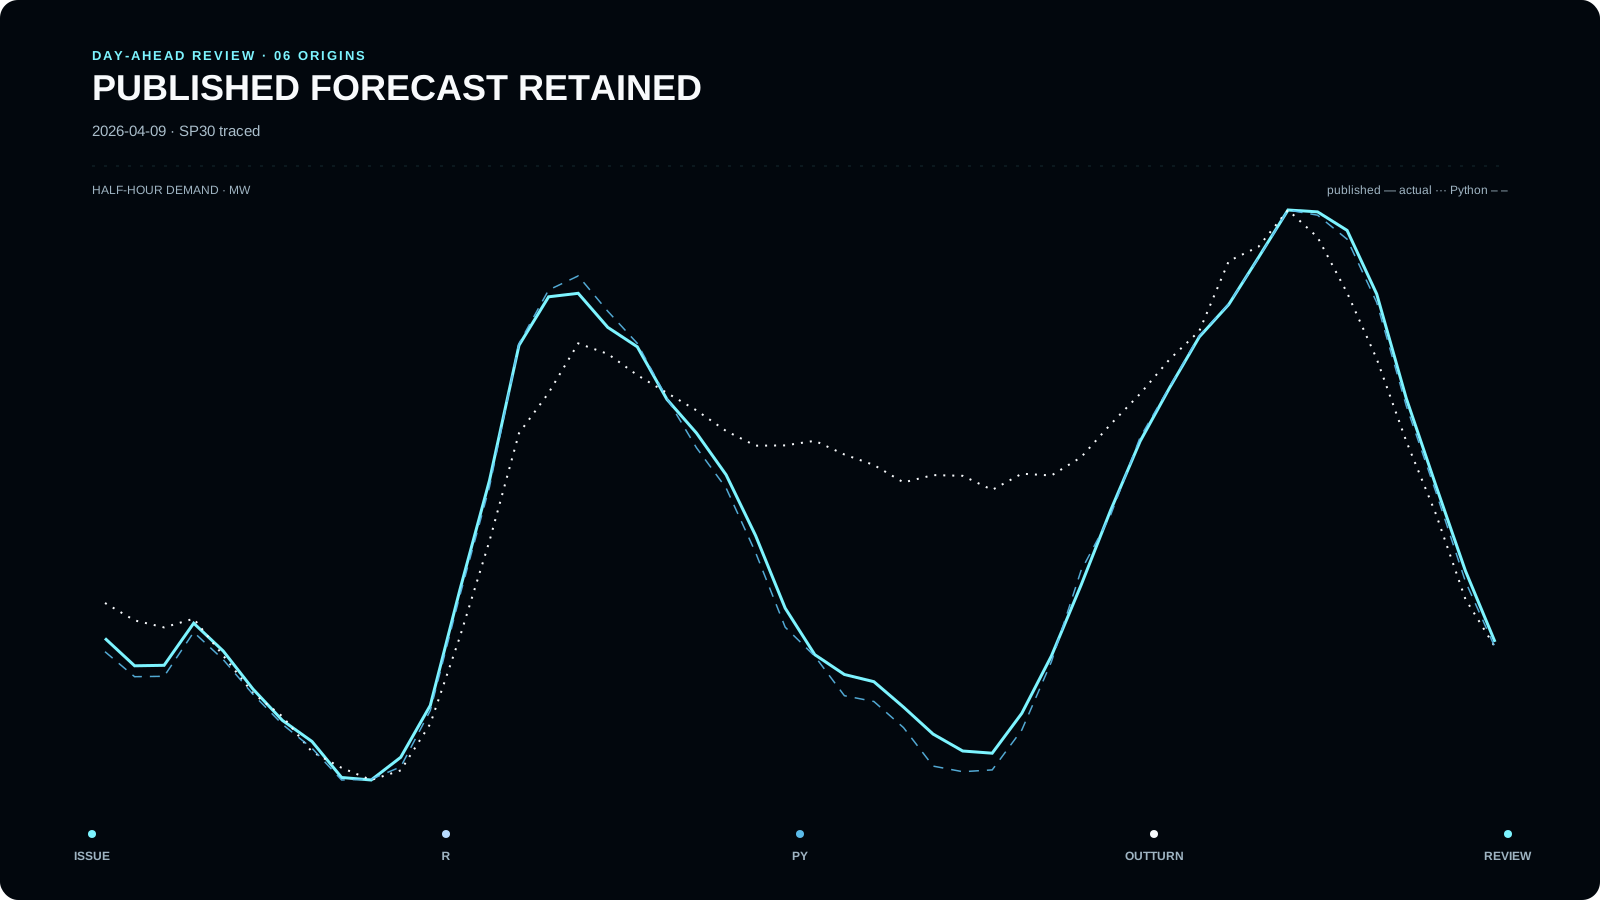
One retained trace
From published half-hour forecast to controlled review.
- 01Published forecast
2026-04-09/SP30 · 20,708 MW · Available at the retained issue time
- 02R linear correction
20,580 MW · Compared, not adopted automatically
- 03Python boosted correction
20,537 MW · Compared, not adopted automatically
- 04Corrected demand outturn
25,045 MW · Observed after the target period
- 05Model-selection decision
r linear correction · Advance the R linear correction to controlled review.
- 06Demand-planning boundary
Human review required · Check weather, embedded generation, events and operating conditions before changing the process
Supported by National Energy SO Open Data. Built by Quanta Meridian as independent non-client example research.
Start with the decision
Bring the question and the evidence that is still missing.
No client delivery is implied by these studies; all three use licensed public data and retained analytical outputs.