Quanta Meridian logo

Power BI examples

Power BI report examples

Explore four reports covering facilities and compliance, margin forecasting, purchase to pay and reporting controls. Each one uses a different layout and analytical approach for the question it needs to answer.

This gallery contains four report examples and 25 report pages. Purchase to Pay also has a complete project page. The other three reports can be inspected here using the page list or the Previous and Next controls.

Power BI reports

Explore Power BI reports built to answer different business questions.

The examples cover facilities and compliance, financial forecasting, purchase to pay and reporting controls. Each report shows how a headline result can lead to the supporting region, contract, process or record.

This gallery contains four report examples. Purchase to Pay also has a complete project page; the other three open as page-by-page report walkthroughs. The editable Power BI files are not available for public download.

Report viewer

Open a report and explore how the information is presented, from high-level summaries to the supporting detail.

Each report can be viewed page by page. Use the page list or the Previous and Next controls, and open any screenshot at a larger size when you need more detail.

Facilities and Compliance Report

Which facilities need attention before the next review?

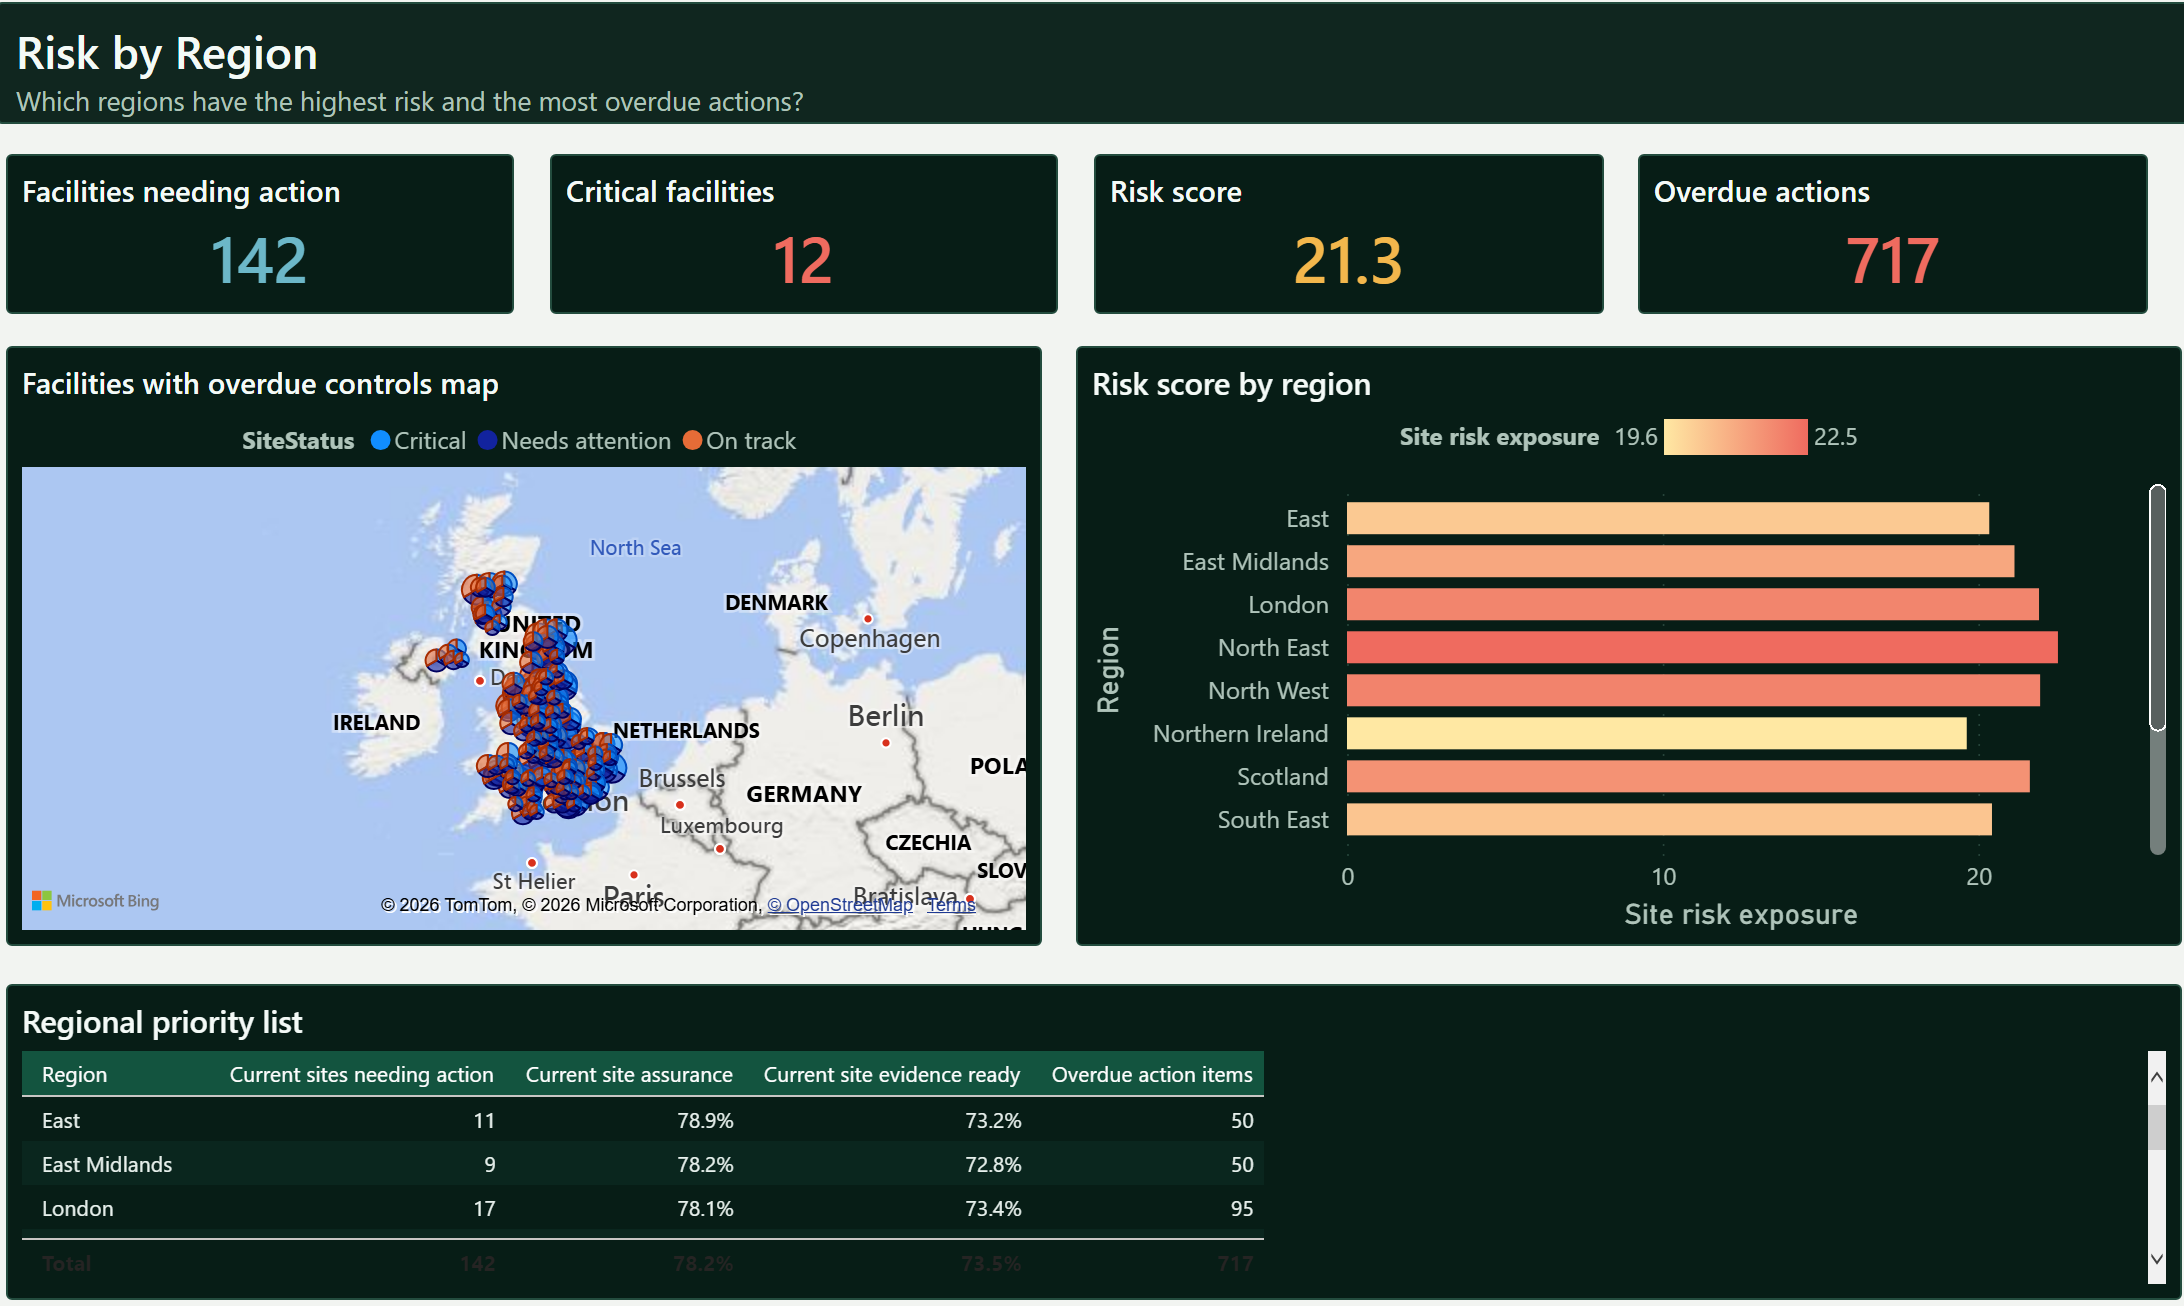
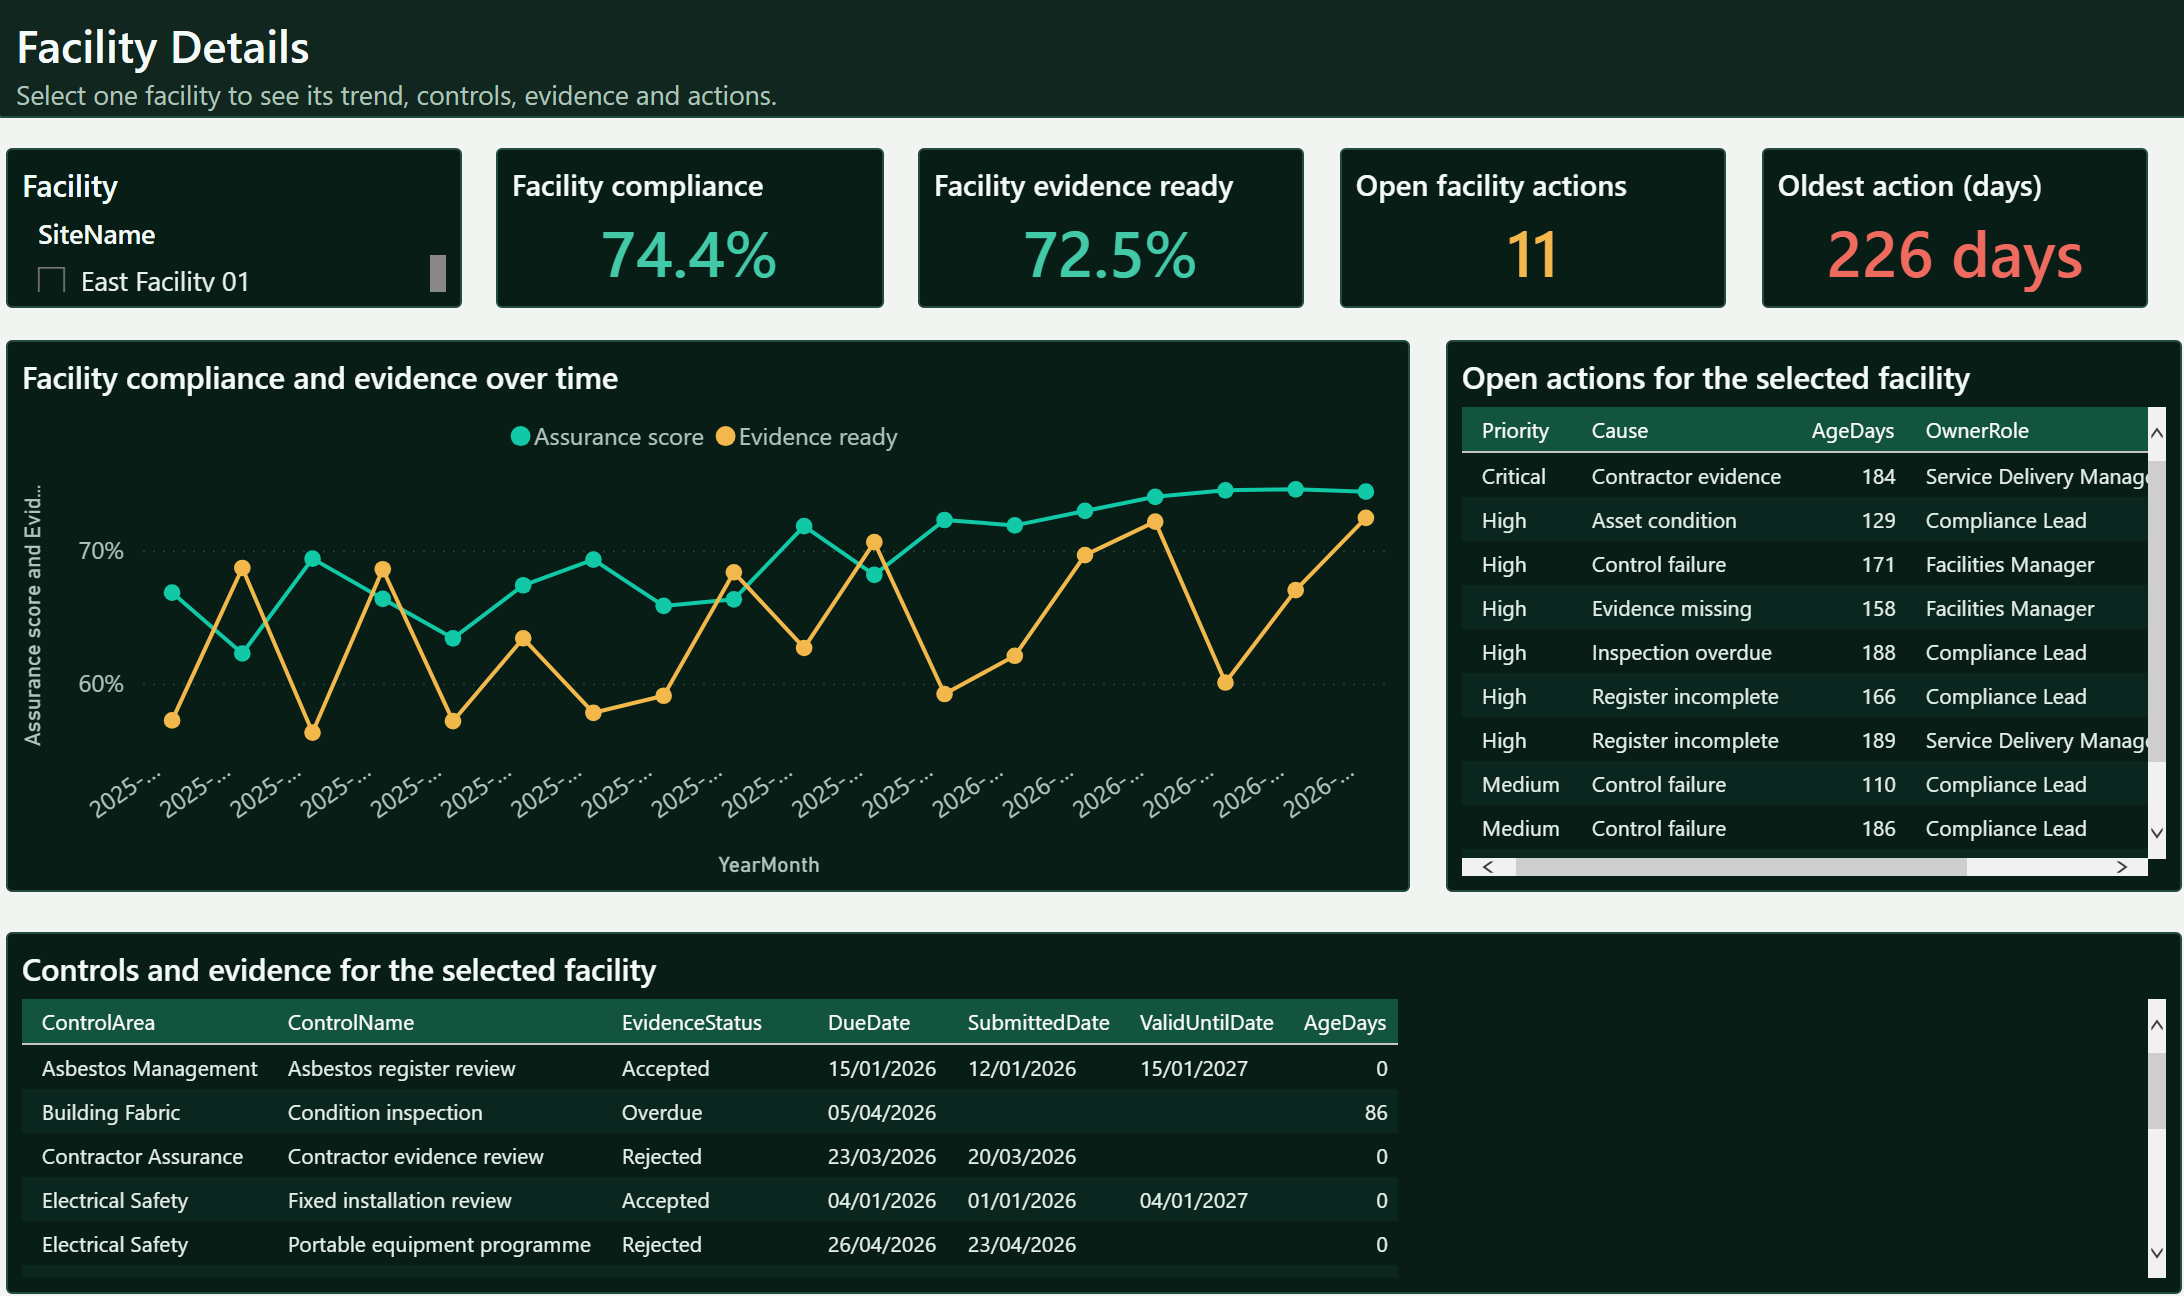
Eight pages show the overall facilities position, the regions and controls driving it, the actions that are overdue and the people responsible for following them up.

Pages
8
Report visuals
82

The fan shows three representative pages. Use the controls below to view the complete report.
Compliance Summary Power BI report pageRisk by Region Power BI report pageFacility Details Power BI report page
Preview8 pages in this report

Report pages

Explore all 8 report pages.

Move through the report in order with Previous and Next, or choose a page from the list. A larger view opens only when you ask for it.

Page 1 of 8

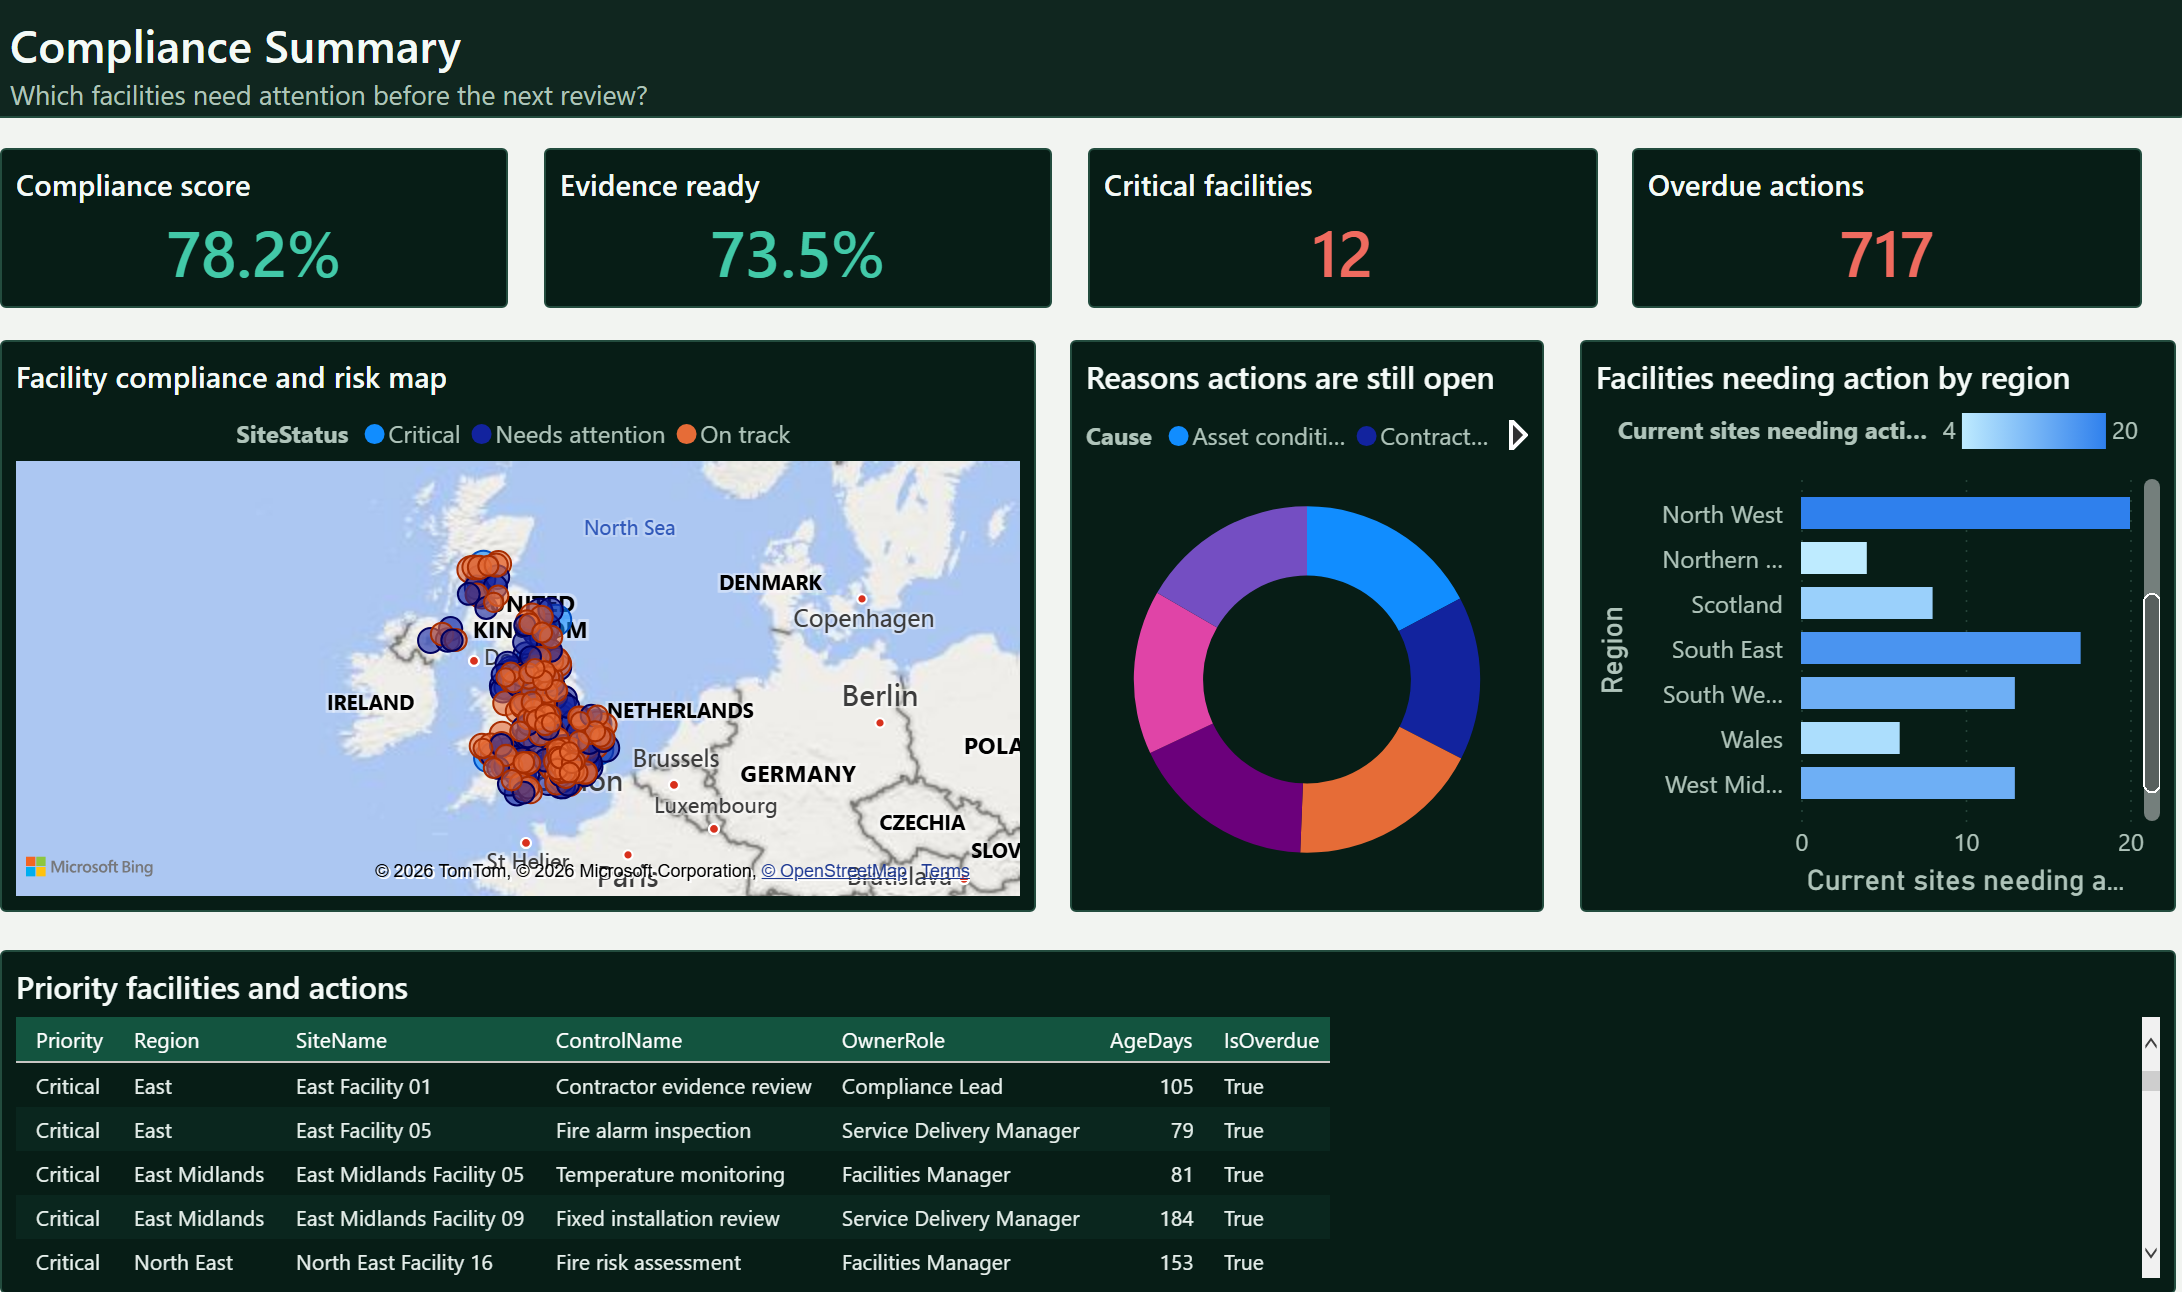
Compliance Summary

What this page shows
Which facilities need attention before the next review?
How it supports the analysis
Prioritise the facilities, control owners and overdue actions that need review first.
What to notice
The review starts at 78.2% compliance and 73.5% evidence readiness, with 12 critical facilities and 717 overdue actions requiring prioritisation.
Important context
The map and status labels prioritise operational review; they do not establish regulatory compliance or control effectiveness.
Read more about this report

What the report covers

The report starts with the overall facilities position, then shows the regions, controls, missing evidence and overdue actions behind it.

A reviewer can open an individual facility, see which controls need attention and identify the role responsible for the follow-up.

What the data highlights

  • The example opens with 78.2% compliance and 73.5% evidence readiness.
  • Twelve facilities are classed as critical, while 142 need some form of action.
  • 717 of the 1,448 open actions are overdue.
  • The report is designed for an operational review rather than a regulatory or audit opinion.

For a live implementation

  • Connect the report to the organisation’s operational data, then agree the reporting date, refresh schedule and owner.
  • Check performance, permissions, keyboard use and screen-reader behaviour in the environment where the report will be used.

Margin Forecast and Scenario Review

What changed the margin forecast, and which response has the most impact?

Five pages explain the current margin, the reasons for the decline, how the forecast changed over time and the effect of the options tested.

Pages
5
Report visuals
43

The fan shows three representative pages. Use the controls below to view the complete report.
Margin Bridge and Drivers Power BI report pageScenario Choice Board Power BI report pageContract Detail and Approval Checks Power BI report page
Preview5 pages in this report

Report pages

Explore all 5 report pages.

Move through the report in order with Previous and Next, or choose a page from the list. A larger view opens only when you ask for it.

Page 1 of 5

Forecast Summary

What this page shows
What changed in the current forecast, and which contracts require review?
How it supports the analysis
Open the contracts behind the latest forecast and move to the detailed bridge before assigning a driver.
What to notice
The current view shows £88M revenue, £36M margin, a 41.1% margin rate and a rounded £2M adverse movement from the prior forecast.
Important context
The compact waterfall on this page displays a £13M total and repeated £2M labels, so it does not reconcile to the headline. Use the detailed bridge page for driver detail until that visual is corrected.
Read more about this report

What the report covers

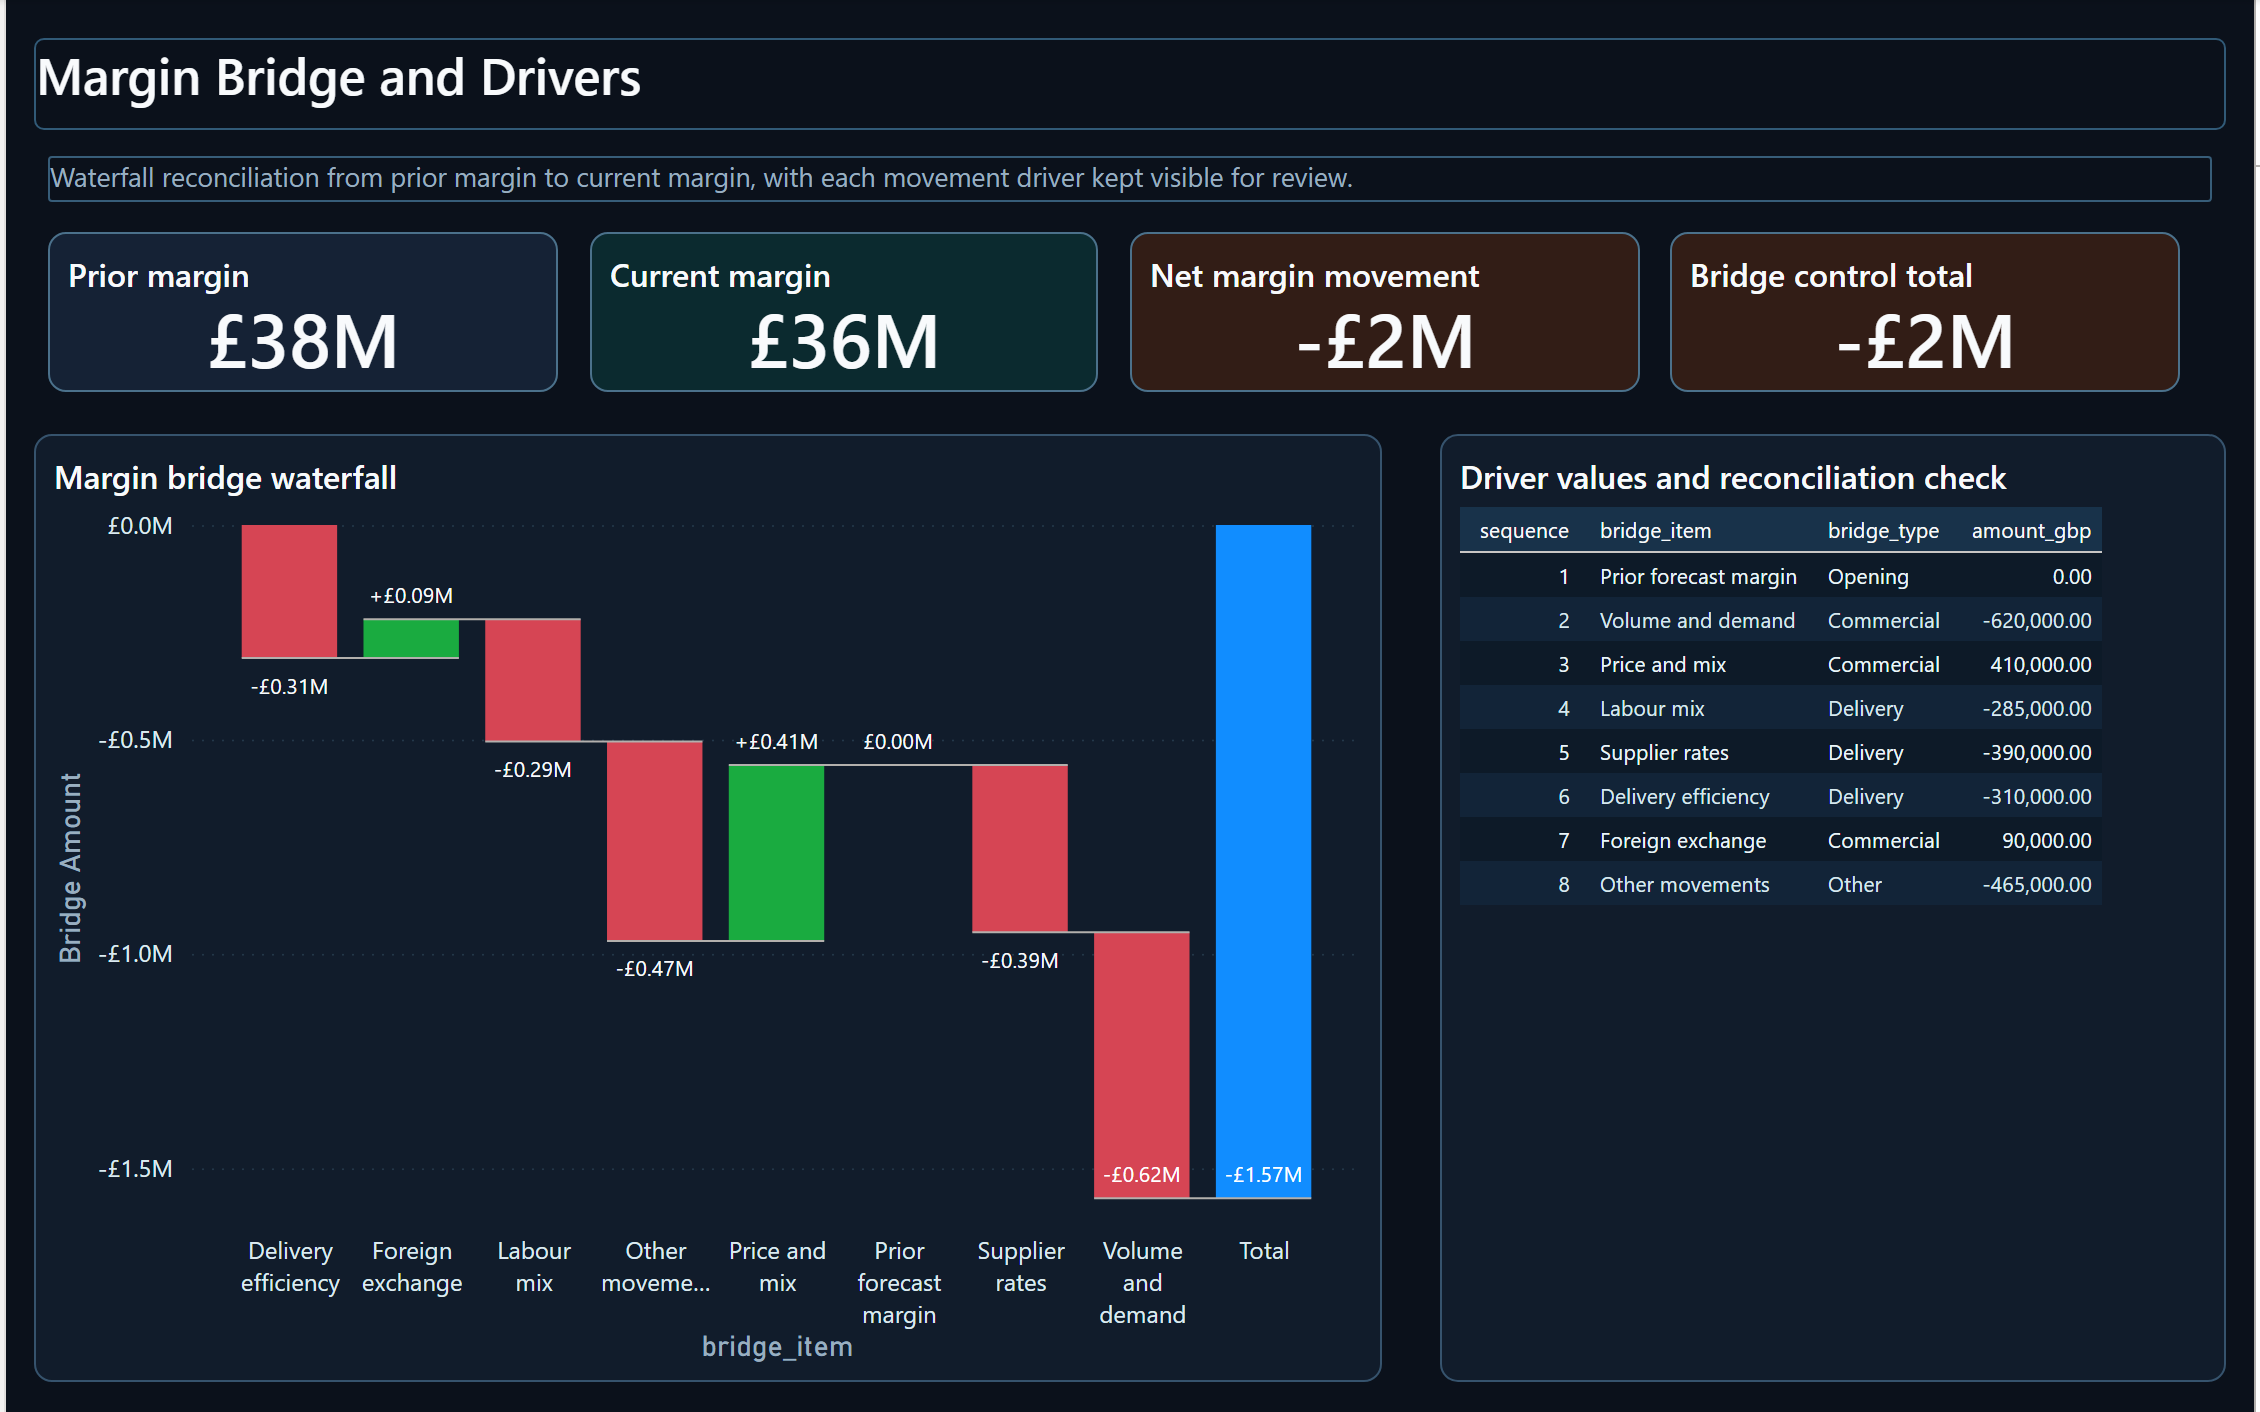
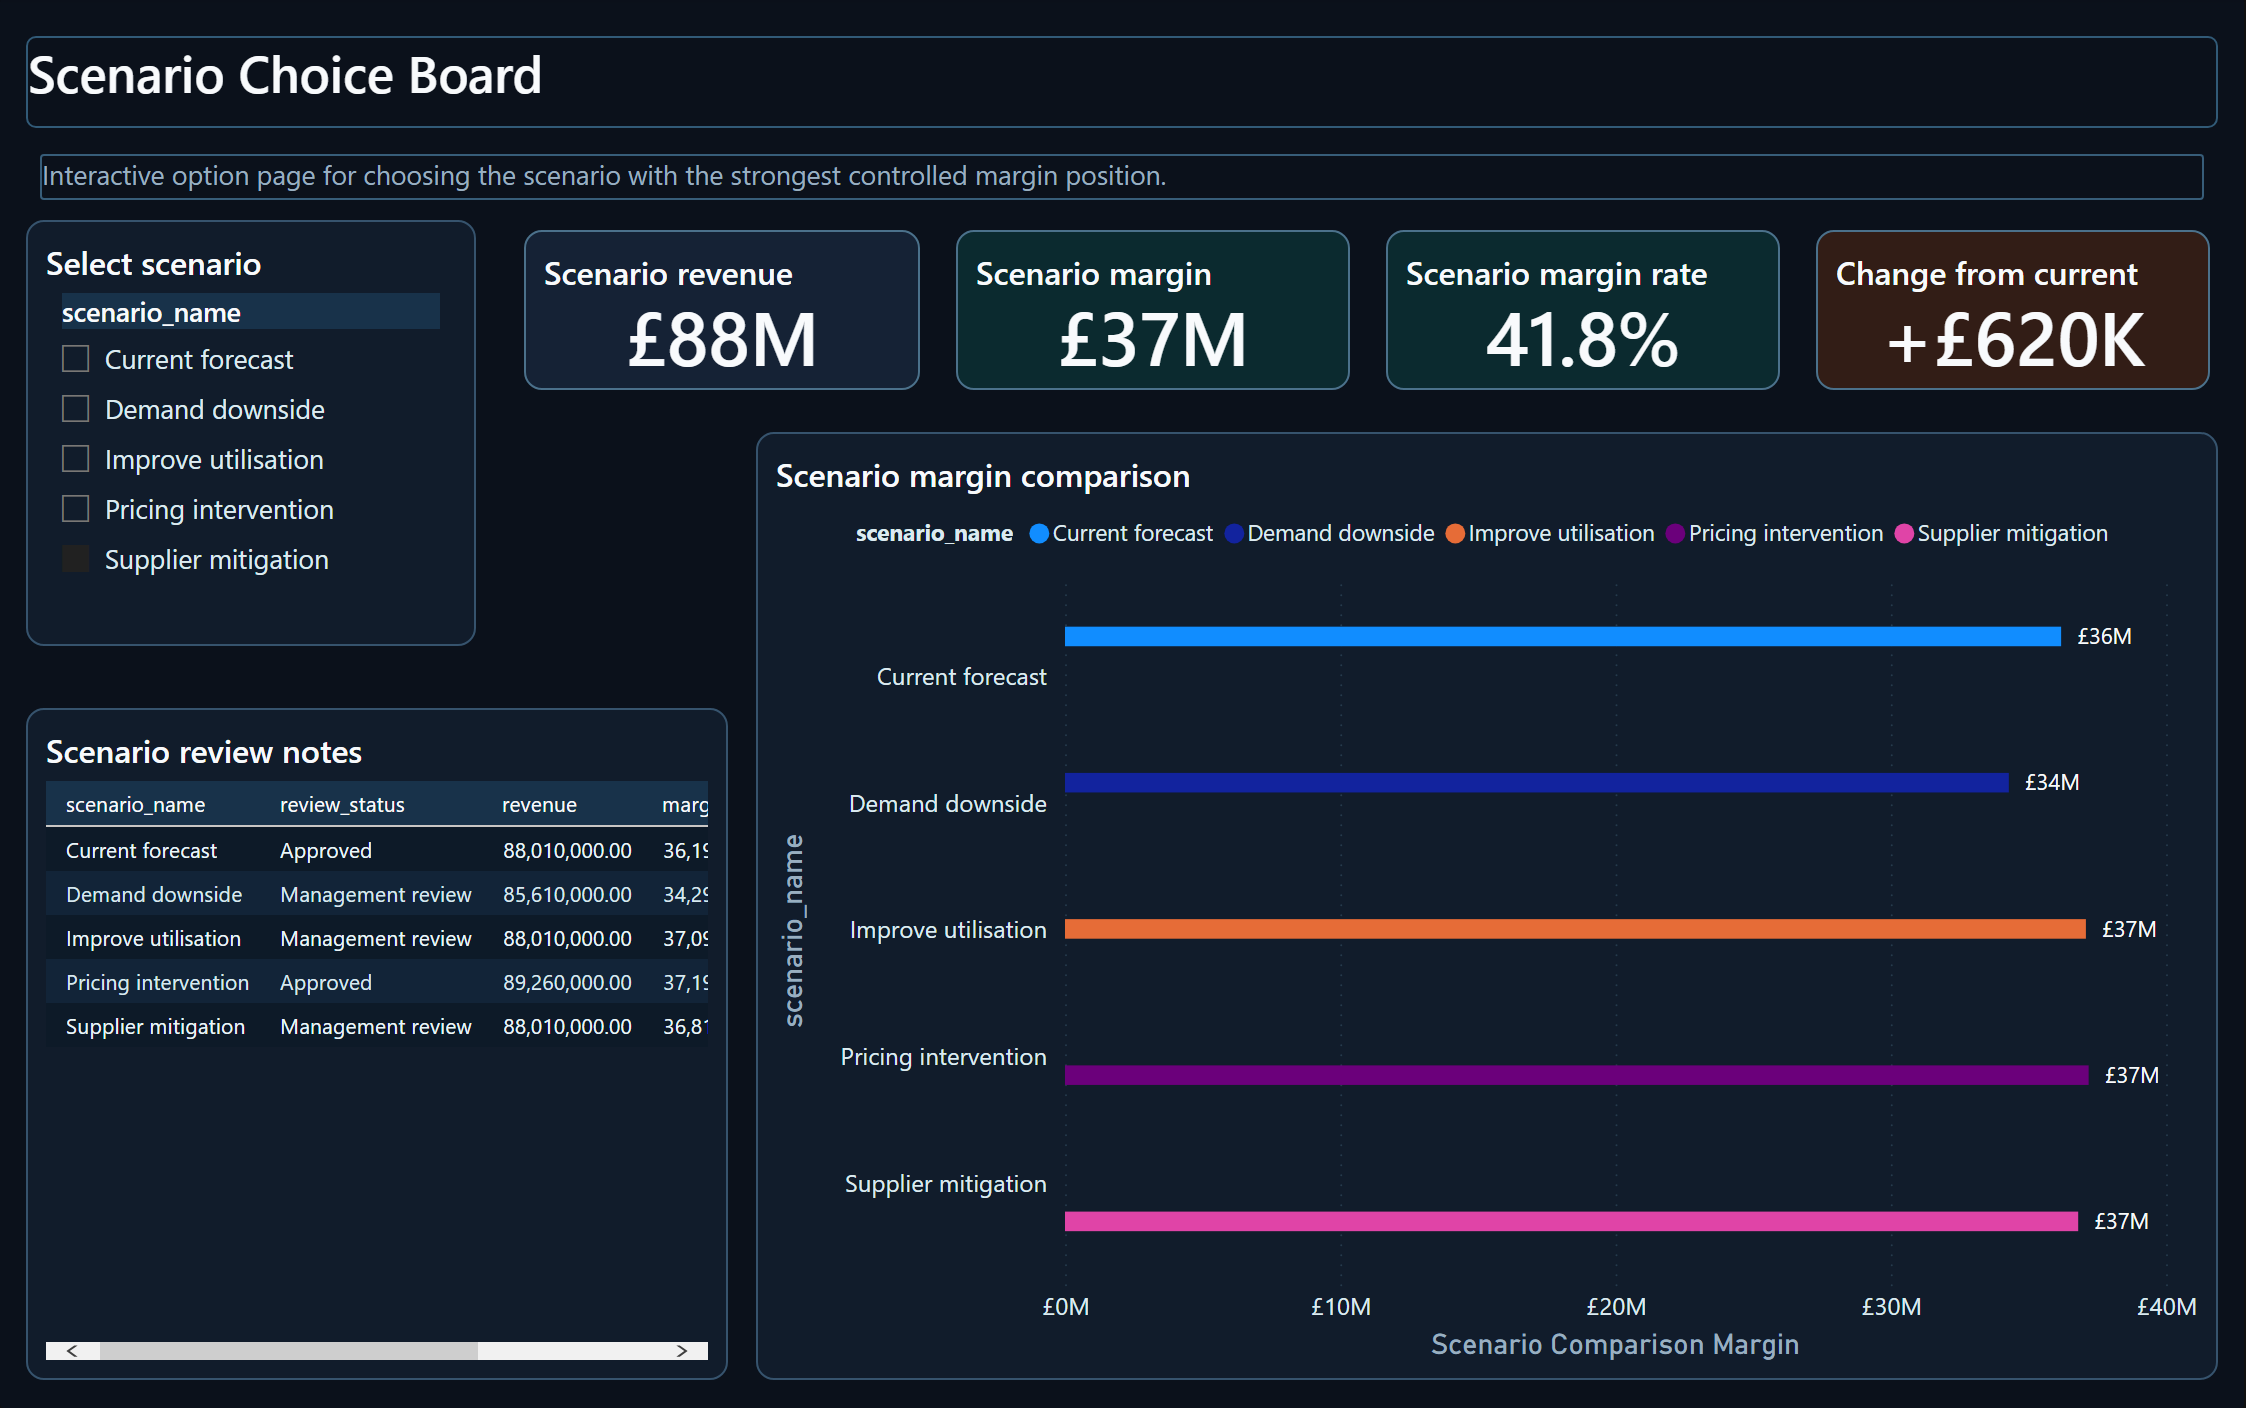
The report explains the £1.57m forecast margin decline, reconciles the detailed drivers and compares the supplier response that was tested.

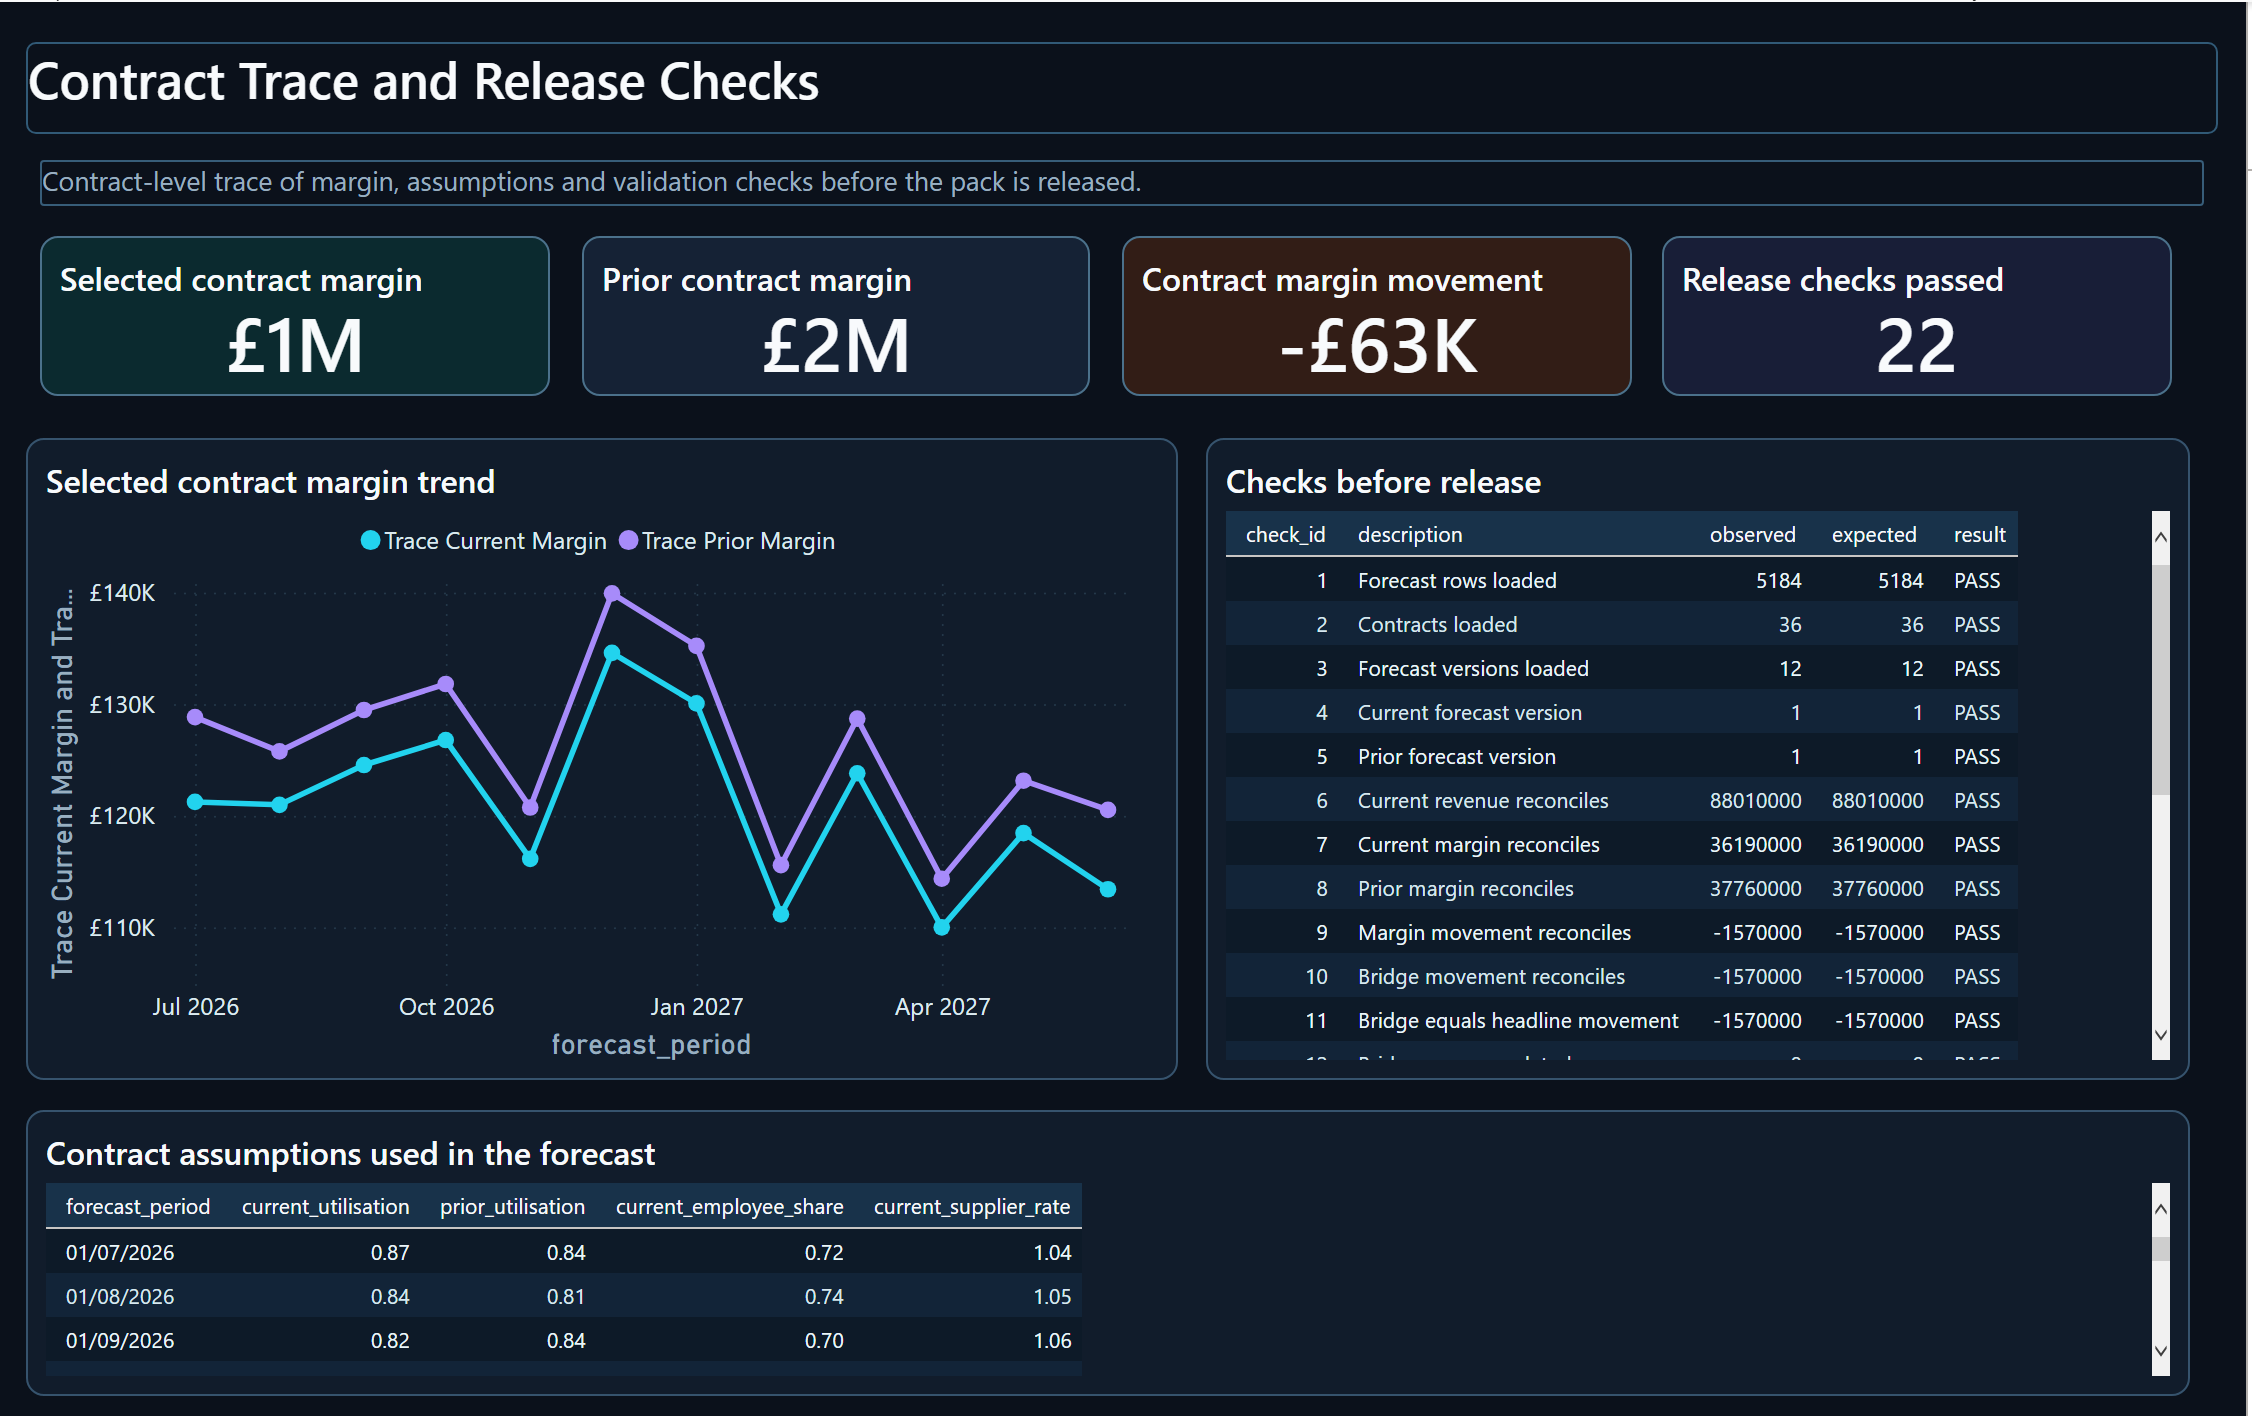
Version history and contract detail show whether the movement is isolated or part of a longer change in the forecast.

What the data highlights

  • The adverse movement is £1.57m: £2.07m of adverse drivers less £0.50m of favourable offsets.
  • The selected supplier option adds £620k and recovers about 39% of the movement.
  • Twelve saved versions show that the forecast has changed over a longer period rather than in one unusual month.
  • The detailed driver bridge is the reconciled view used to explain the movement.

For a live implementation

  • Connect the report to the organisation’s planning and contract data, then agree the reporting period, scenario assumptions and owner.
  • Align the summary view with the detailed bridge, then test refresh performance, permissions and accessibility in the target environment.

Purchase to Pay Process Analysis

Where does purchase to pay slow down?

Six pages show where purchase-to-pay work waits, which routes create the most volume, where payment blocks are concentrated and how one delayed item moved through the process.

Pages
6
Report visuals
63

The fan shows three representative pages. Use the controls below to view the complete report.
Where does purchase to pay slow down? Power BI report pageWhere are waits concentrated? Power BI report pageDelayed purchase items Power BI report page
Preview6 pages in this report

Report pages

Explore all 6 report pages.

Move through the report in order with Previous and Next, or choose a page from the list. A larger view opens only when you ask for it.

Page 1 of 6

Where does purchase to pay slow down?

What this page shows
Where does purchase-to-pay work slow down, and which hand-offs should be reviewed first?
How it supports the analysis
Start with hand-offs that combine high volume with high median or p90 waiting time, then open the transition records.
What to notice
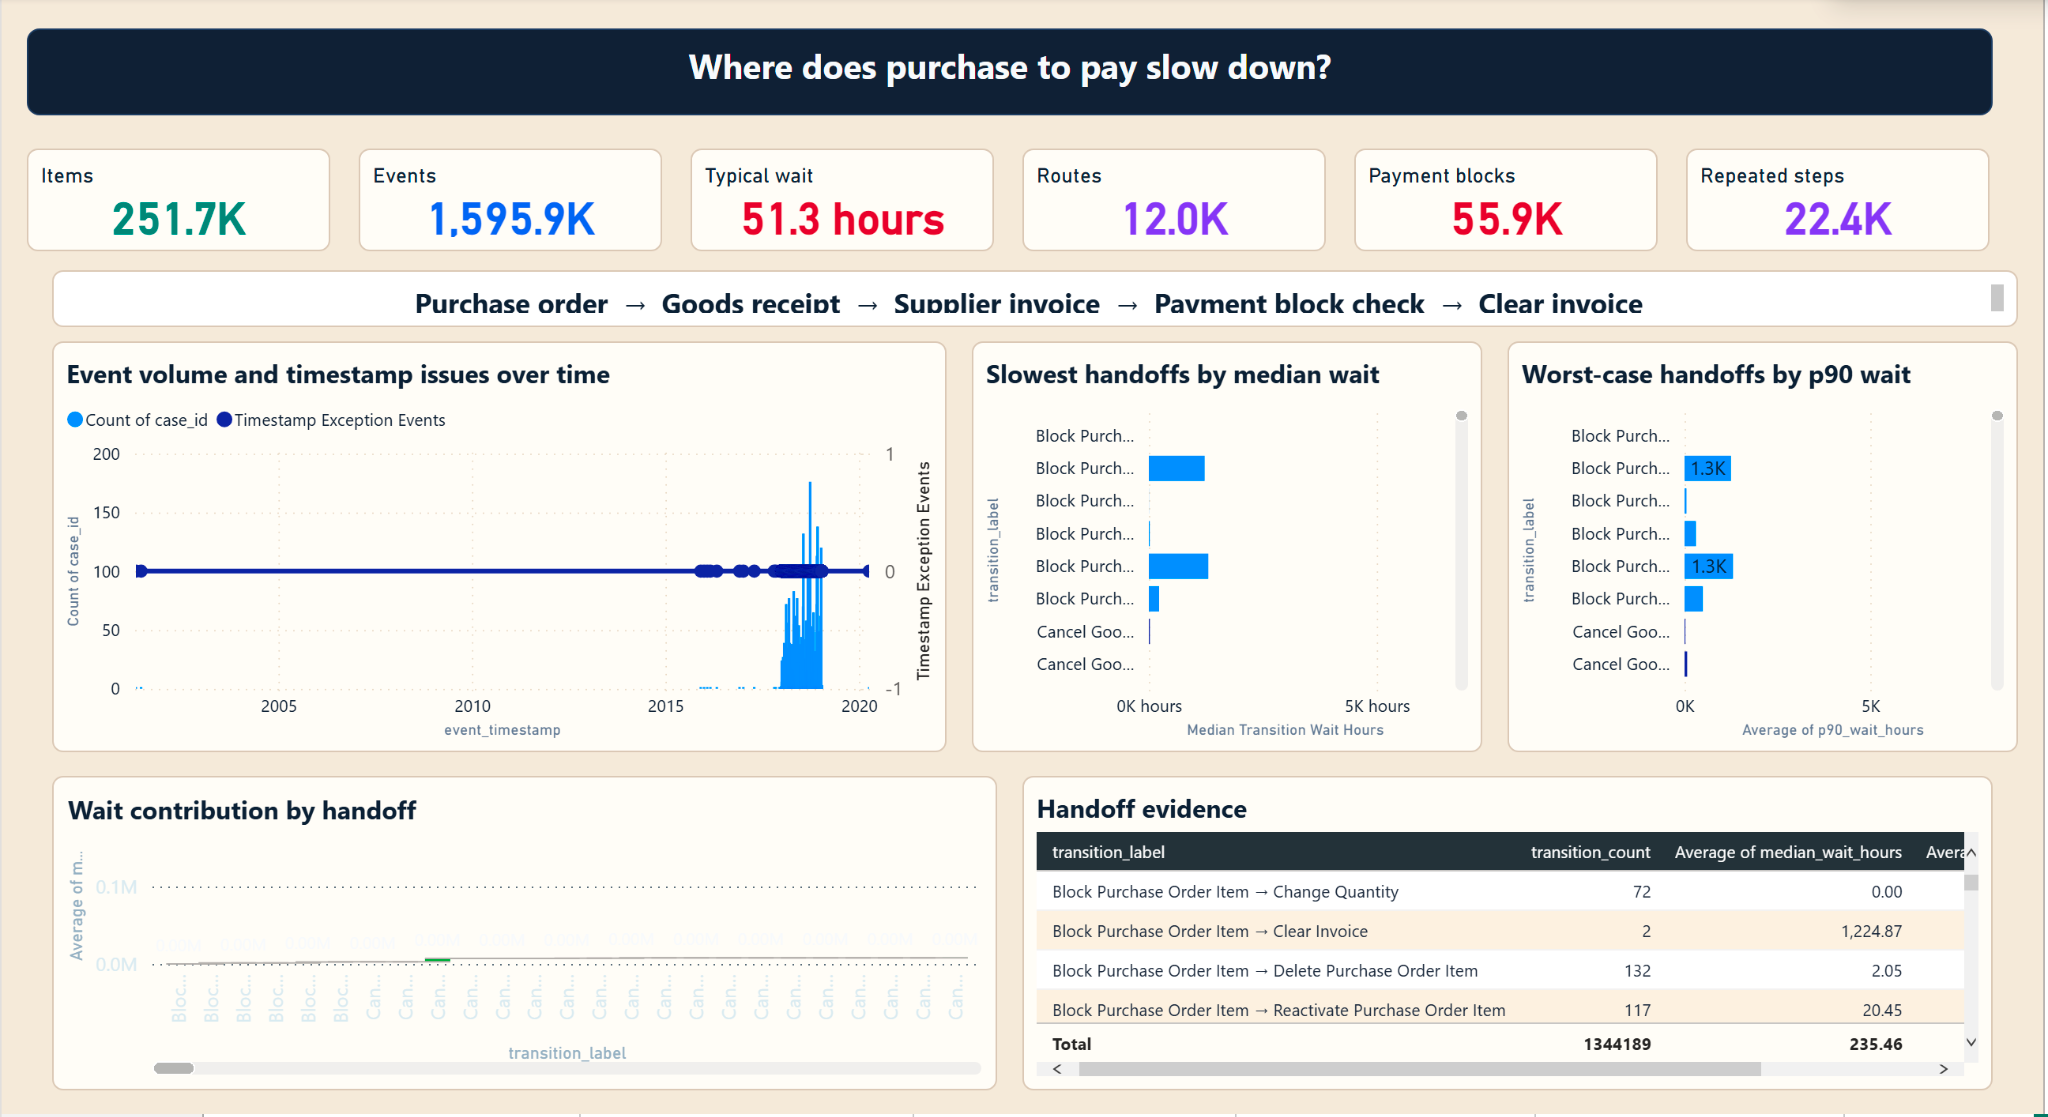
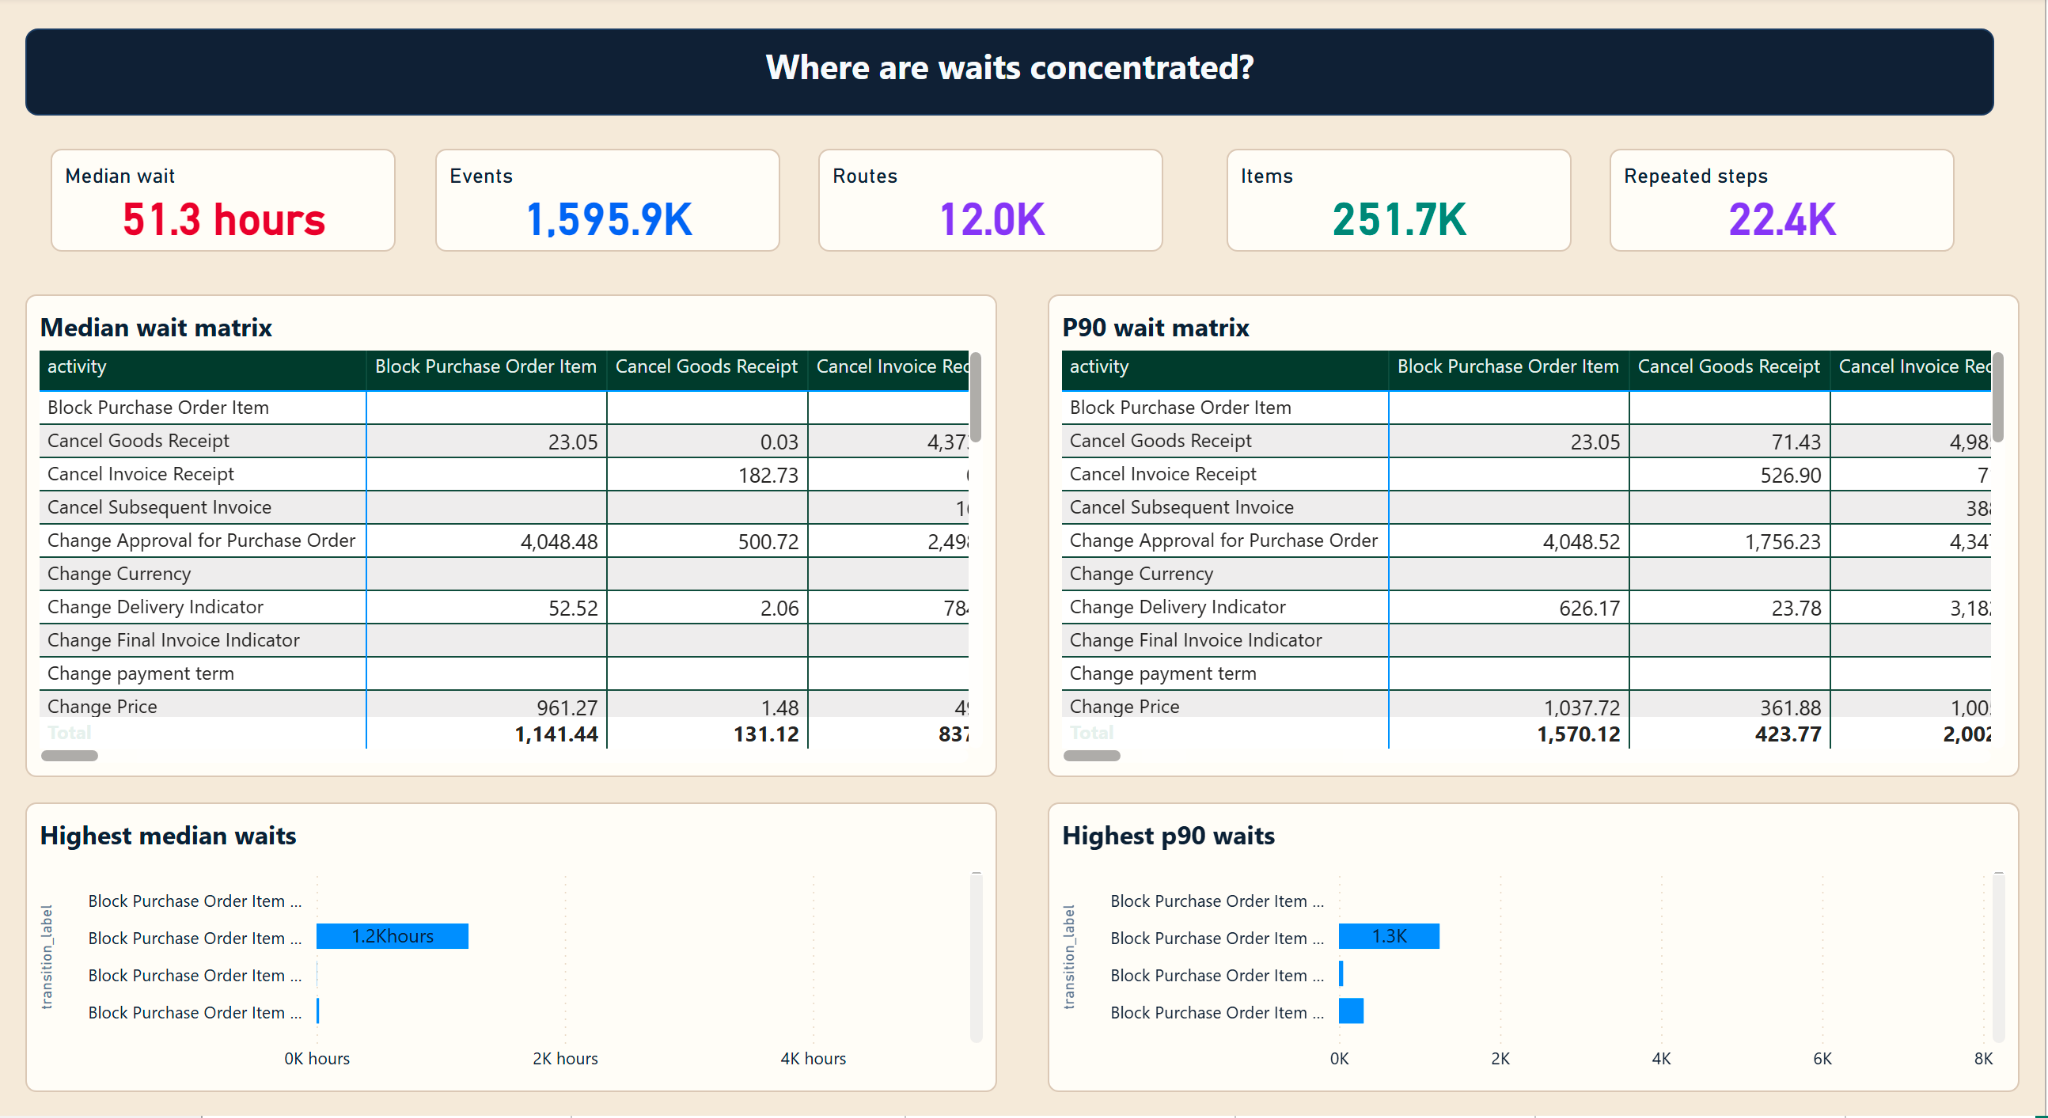
The report covers 251,734 purchase-order items and 1,595,923 events. The typical adjacent-event wait is 51.3 hours across 11,973 recorded routes.
Important context
the time series includes timestamp exceptions and historical outliers. Sequence and elapsed time identify records for review but do not establish root cause.
Read more about this report

What the report covers

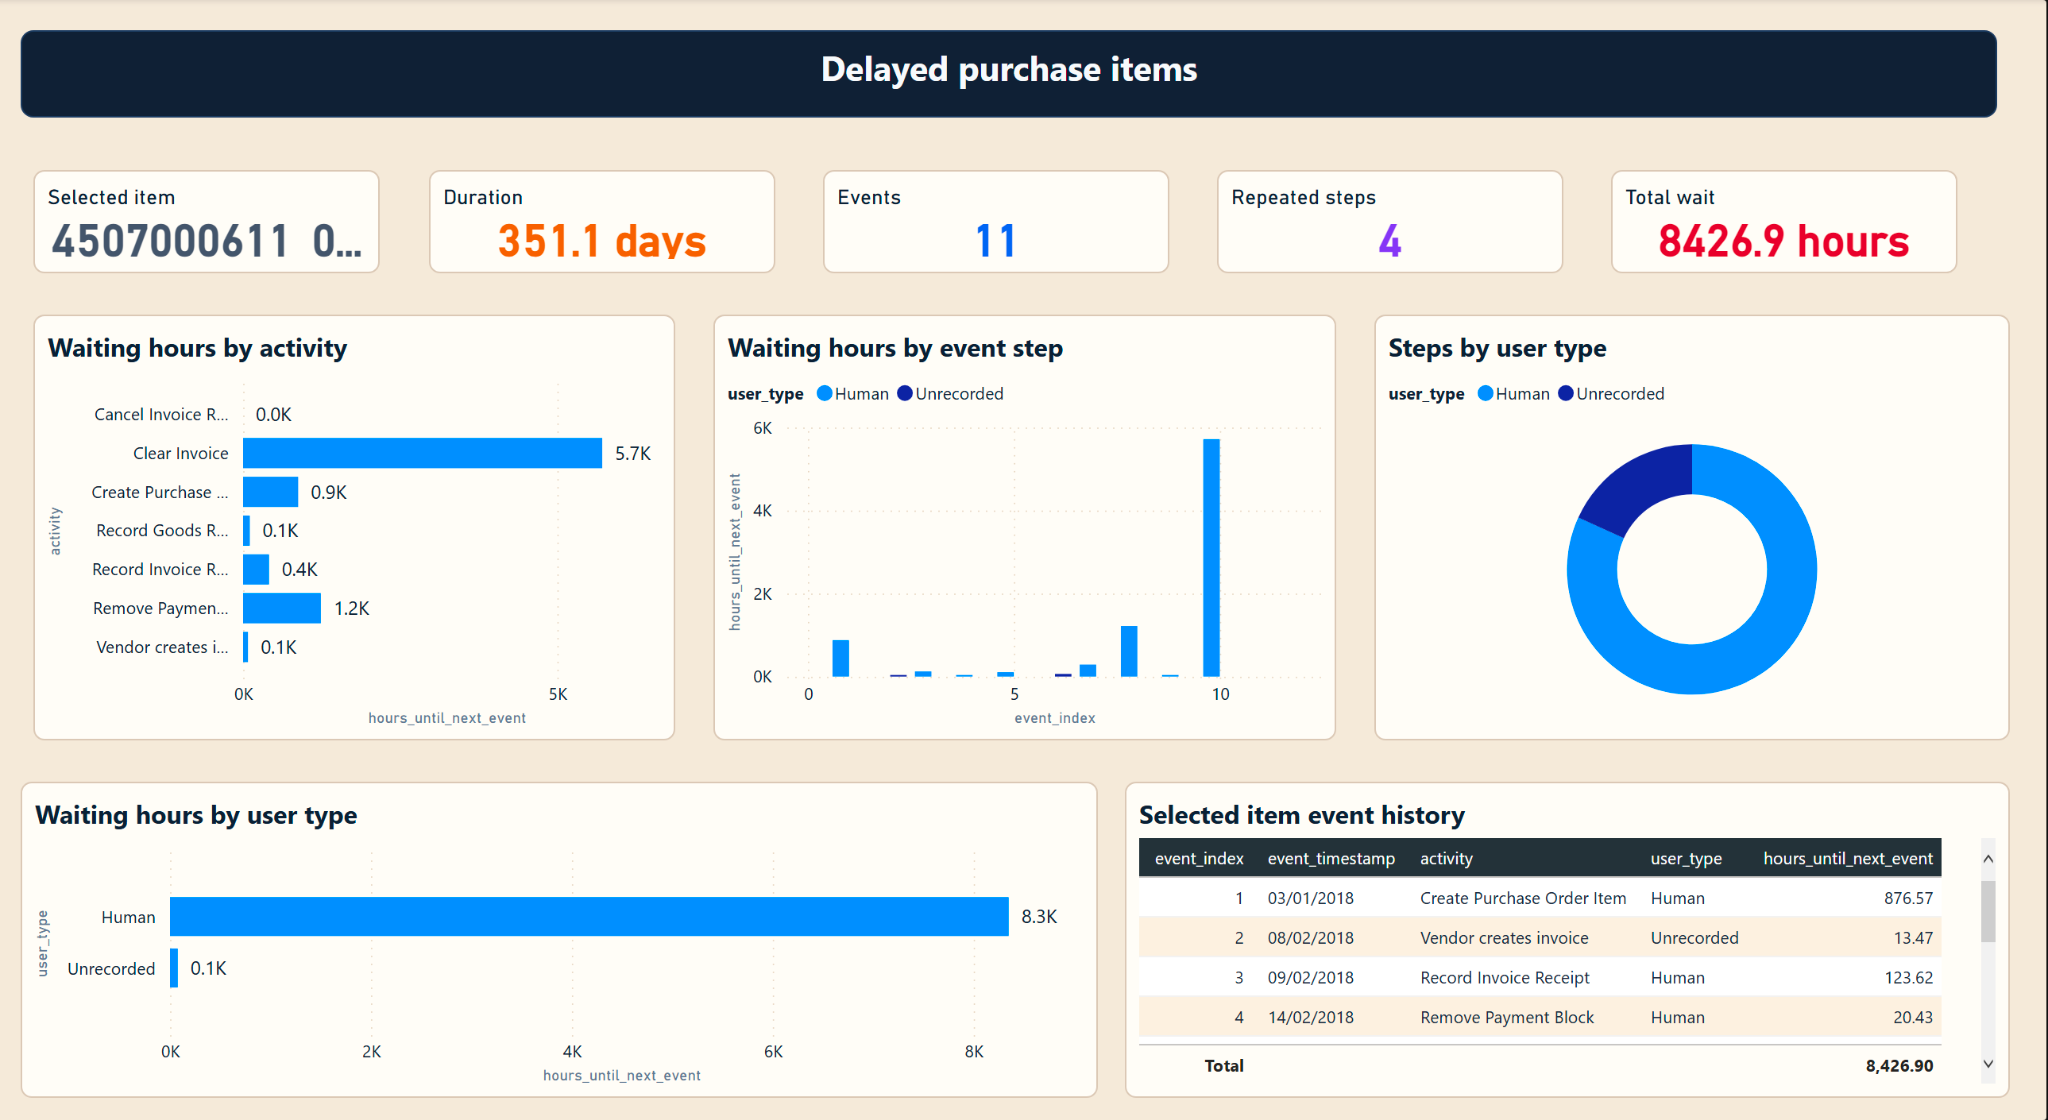
The report analyses 251,734 purchase-order items and 1,595,923 events. It moves from overall routes and waiting times to the history of one delayed item.

The remaining pages compare common routes, long waits, repeated work, payment risk and the checks behind the totals.

What the data highlights

  • The analysis covers 251,734 purchase-order items and 1,595,923 recorded events from the BPI Challenge 2019 log.
  • 11,973 process variants show how many different routes the work can take.
  • The broad payment-block flag covers 55,934 items, while 122 items contain the explicit Set Payment Block event. The two figures answer different questions.
  • The selected item took 351.1 days and accumulated 8,426.9 hours between recorded steps.

For a live implementation

  • Connect the report to the intended purchasing and invoice data, then agree the reporting period, refresh schedule and owner.
  • Test performance, permissions and accessibility in the target environment before wider use.

Reporting Controls and Data Quality Review

Can the report be signed off?

Six pages show whether the expected data arrived, the measures are defined, the totals agree and outstanding actions have an owner before the report is signed off.

Pages
6
Report visuals
61

The fan shows three representative pages. Use the controls below to view the complete report.

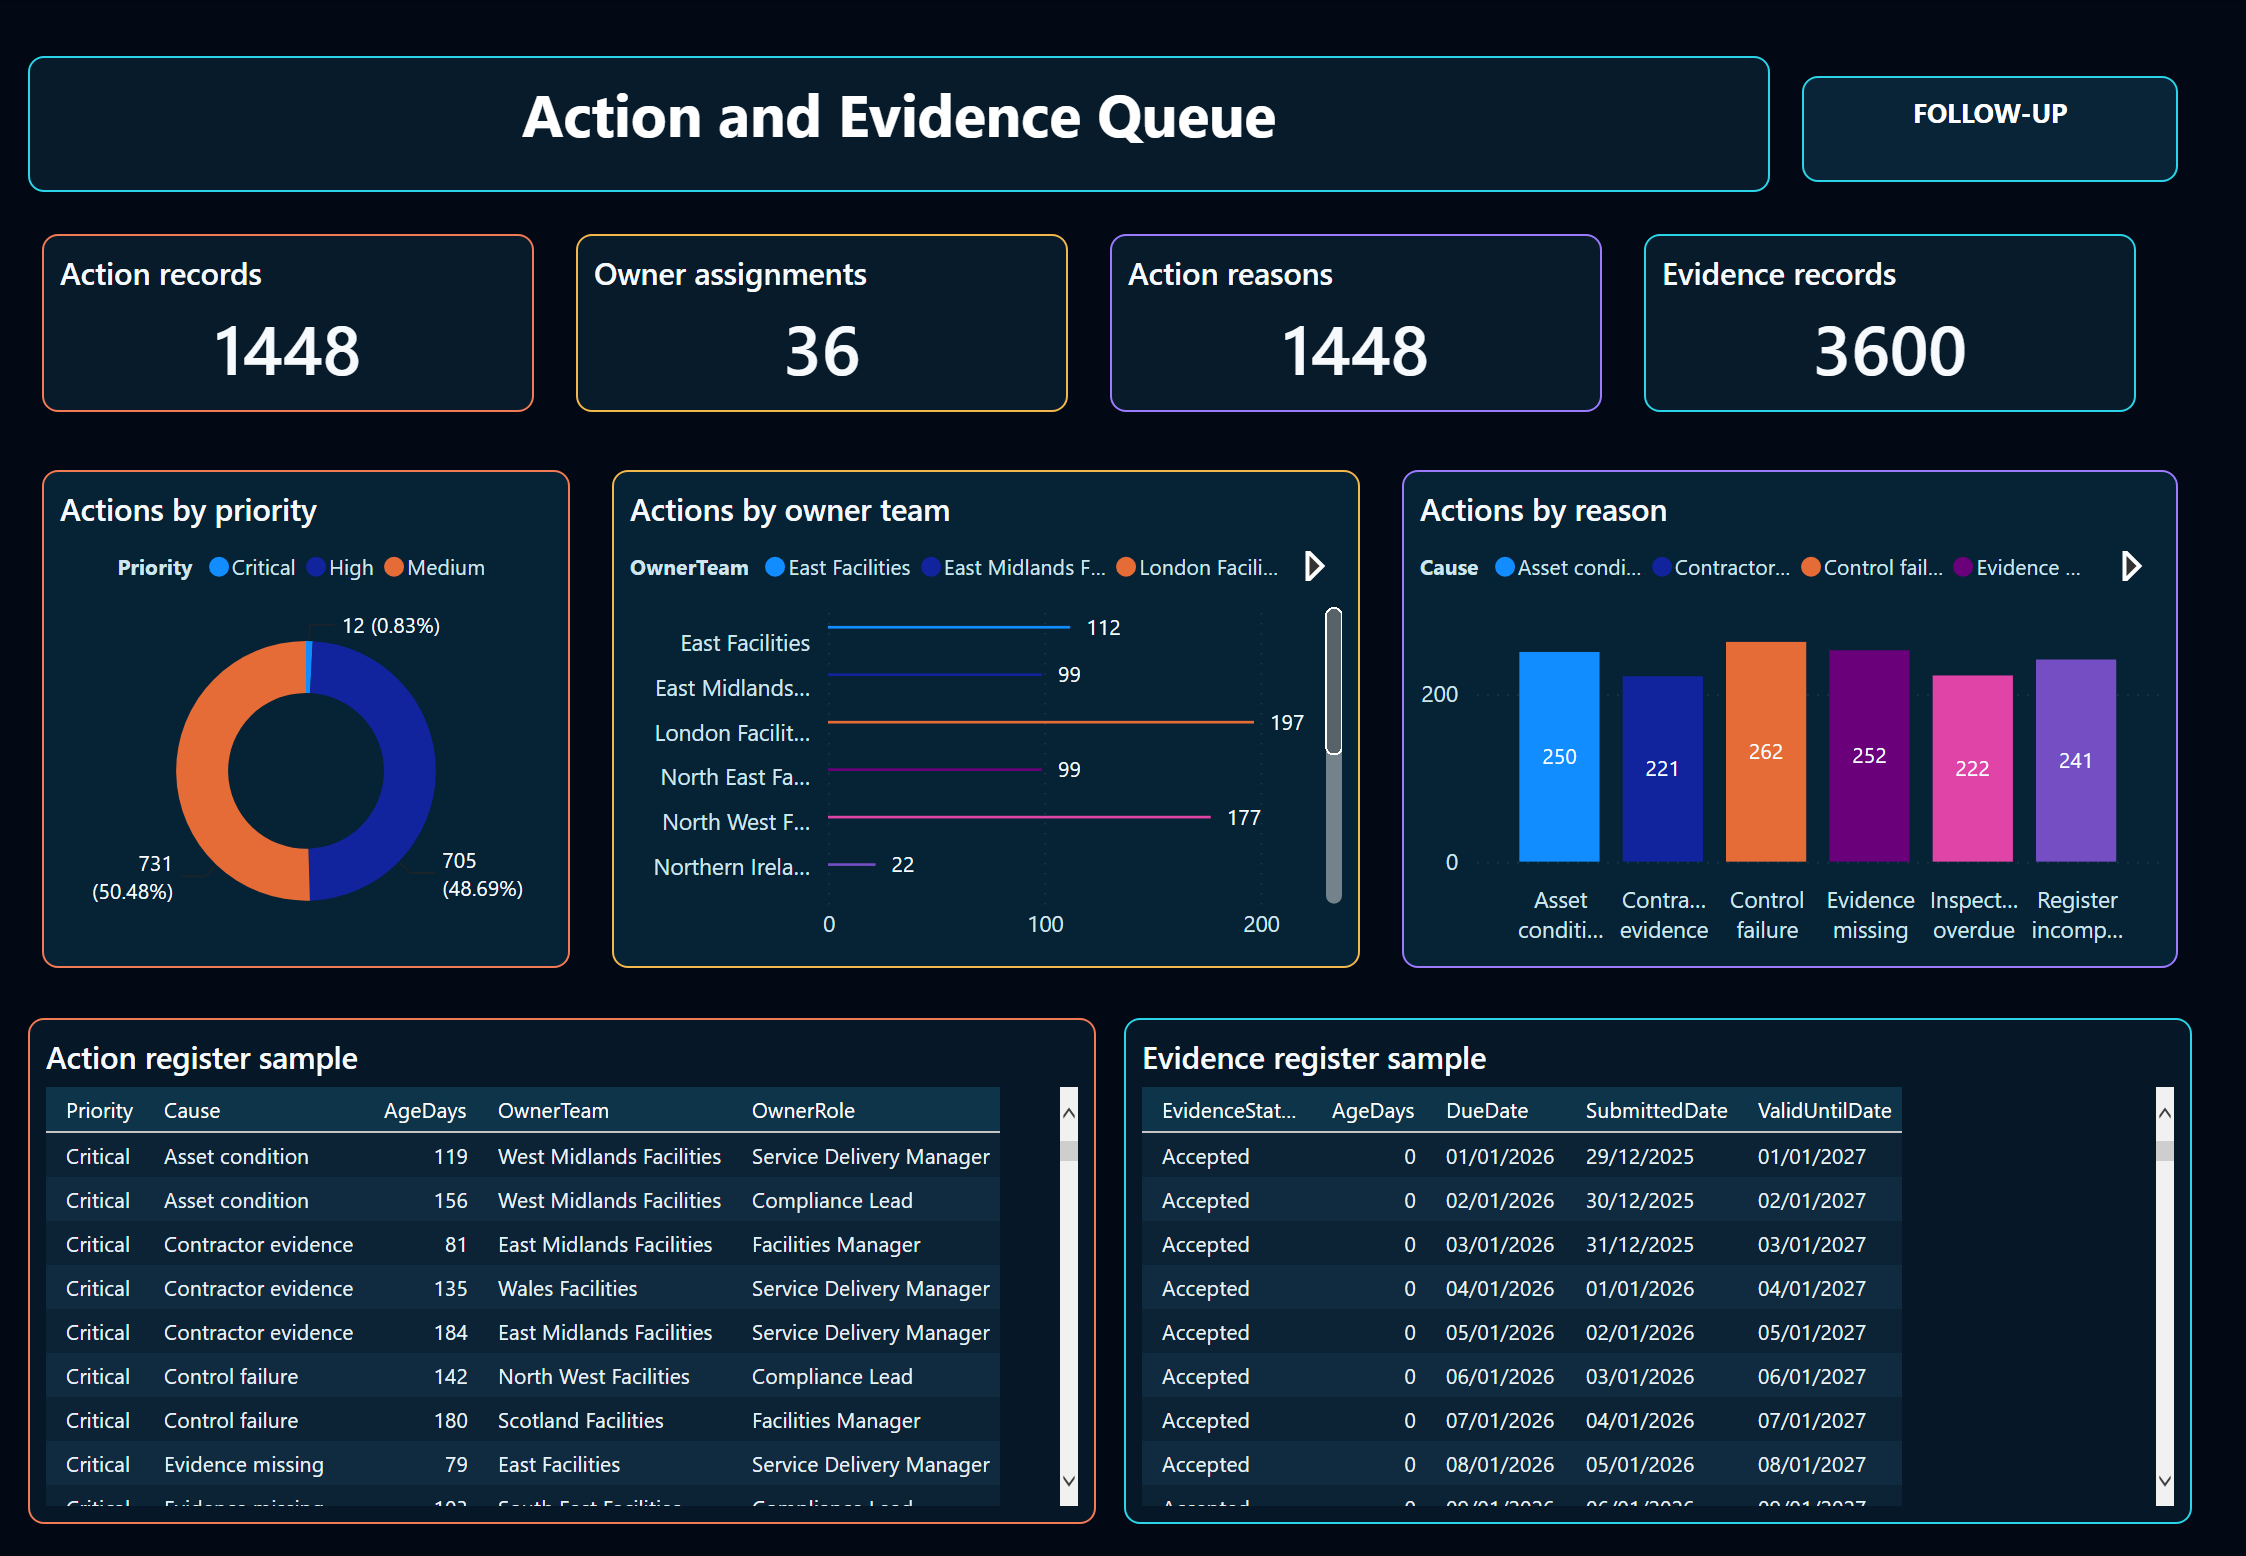
Governance and Approval Checks Power BI report pageData Quality Evidence Power BI report pageAction and Evidence Queue Power BI report page
Preview6 pages in this report

Report pages

Explore all 6 report pages.

Move through the report in order with Previous and Next, or choose a page from the list. A larger view opens only when you ask for it.

Page 1 of 6

Governance and Approval Checks

What this page shows
Is the supporting information complete enough to pass its sign-off check?
How it supports the analysis
Confirm the approval checks, metric definitions and supporting information before allowing the reporting pack to proceed.
What to notice
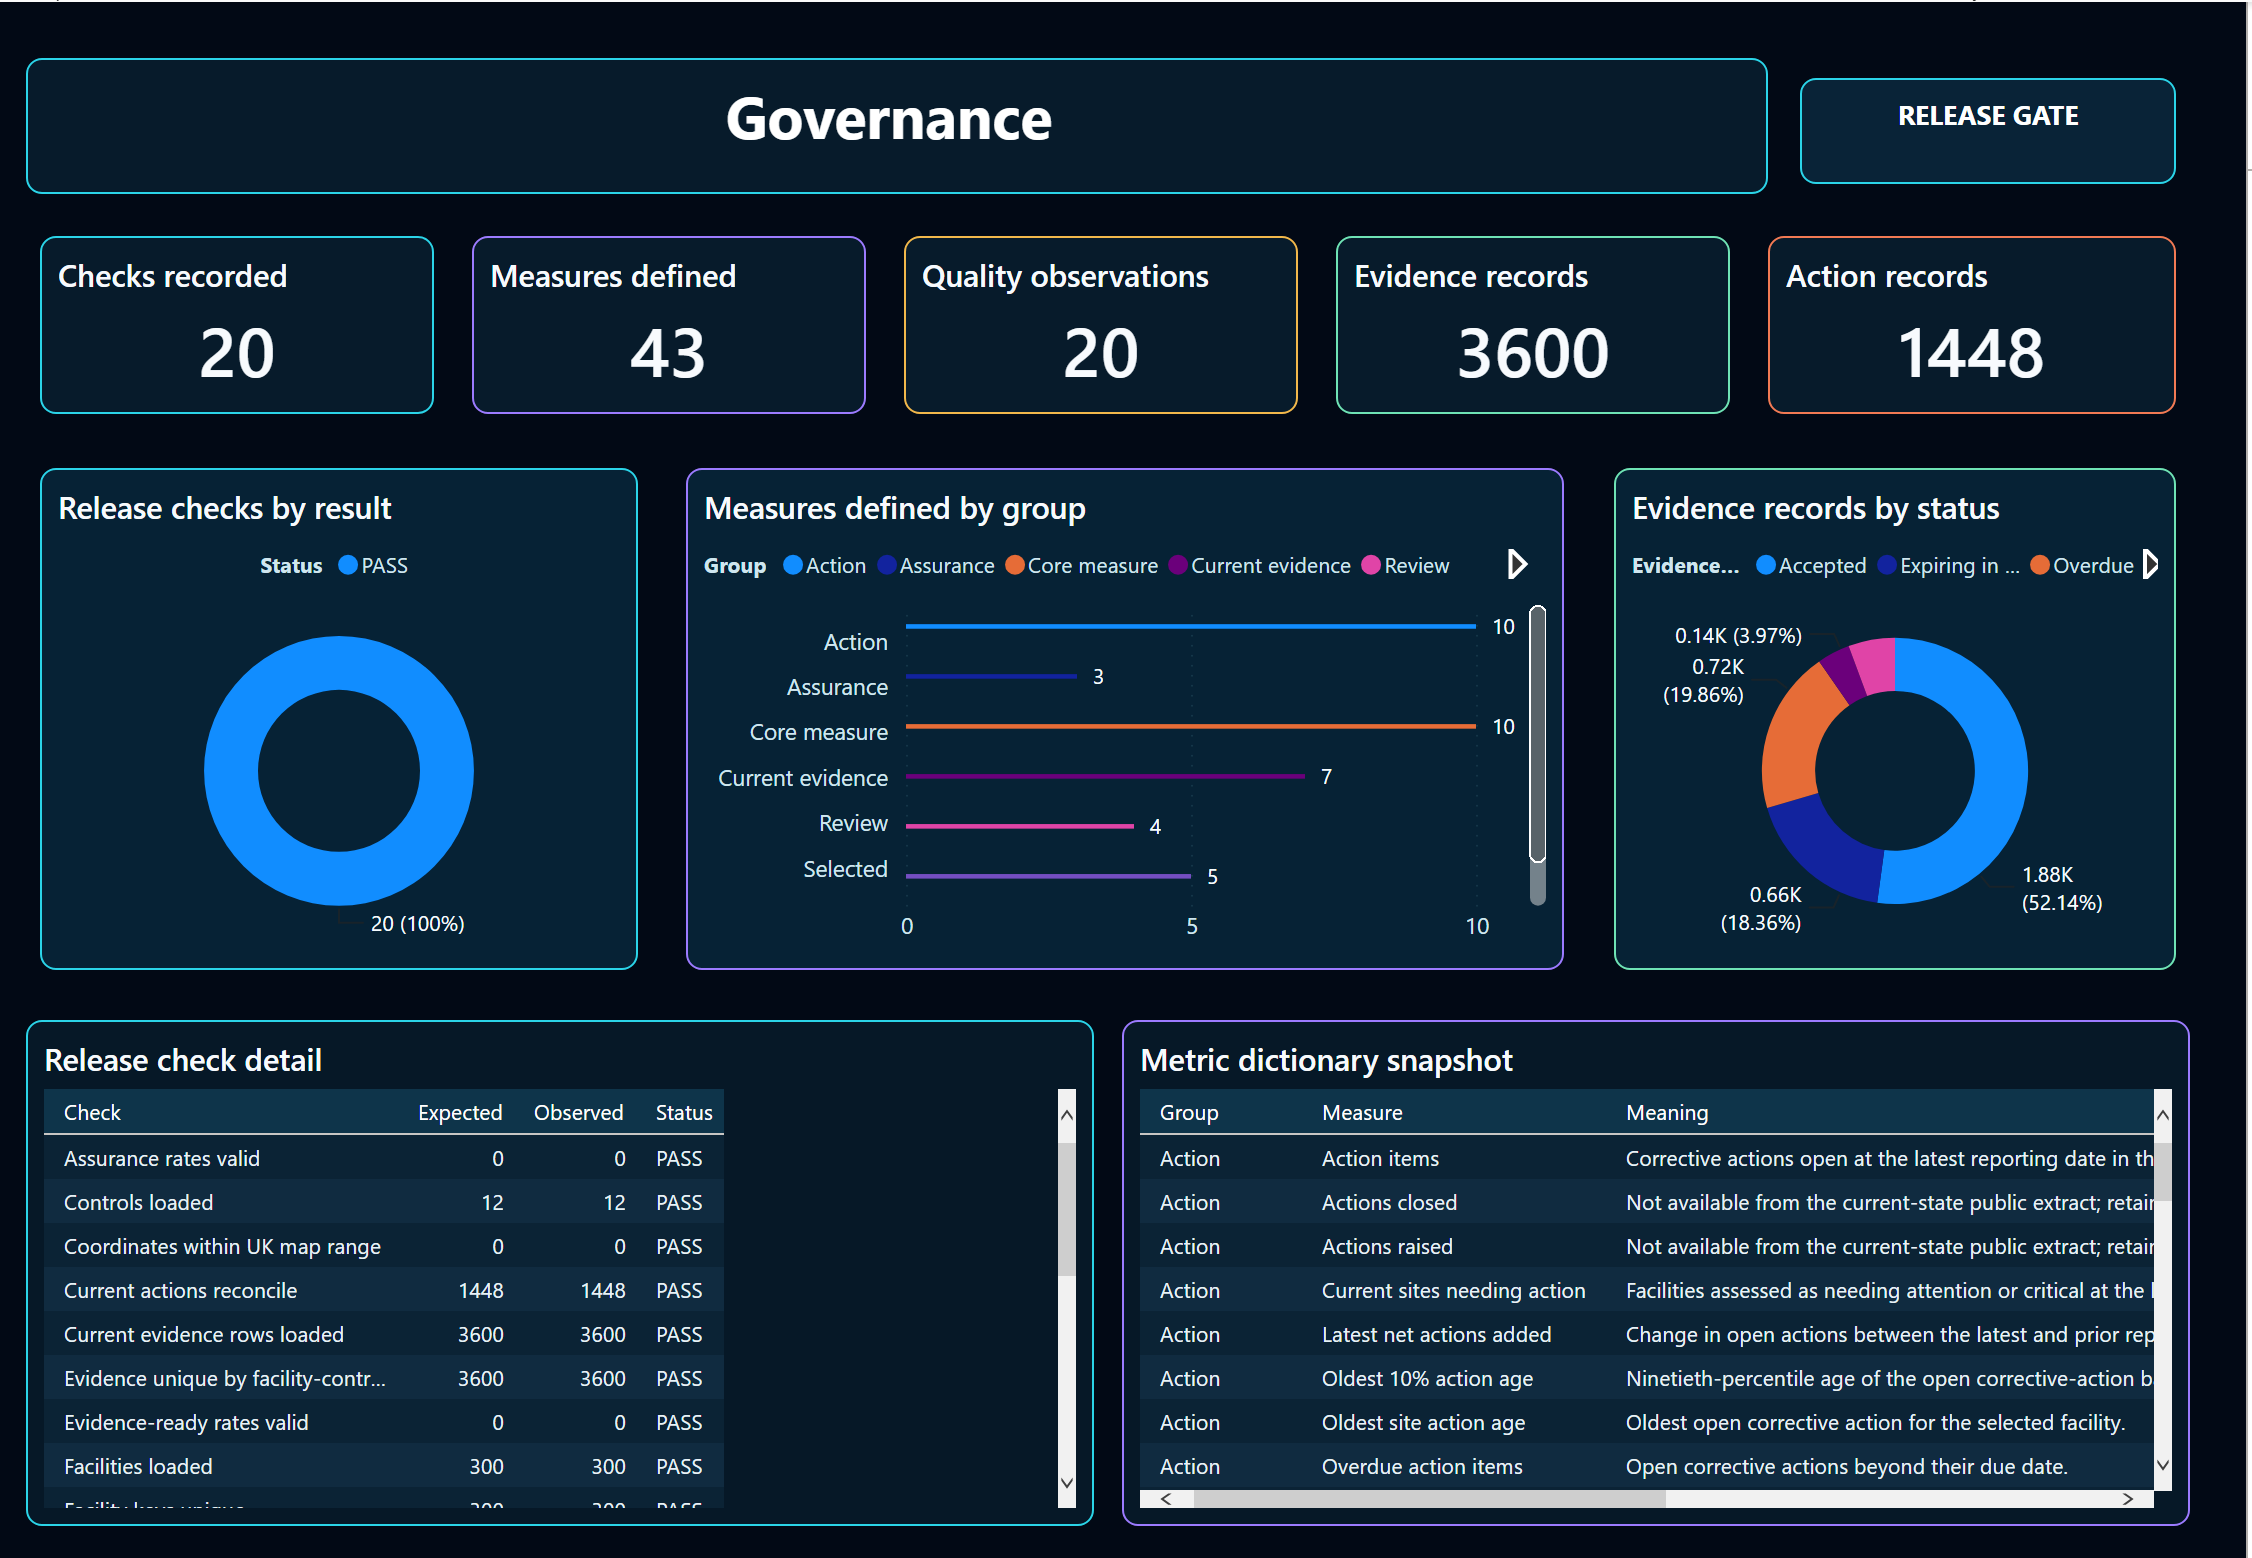
Twenty recorded checks are shown as passing, with 43 defined measures, 3,600 evidence records and 1,448 action records available for review.
Important context
The checks are generated from the same report data as the report. A 100% pass result demonstrates the control pattern, not independent assurance or production operation.
Read more about this report

What the report covers

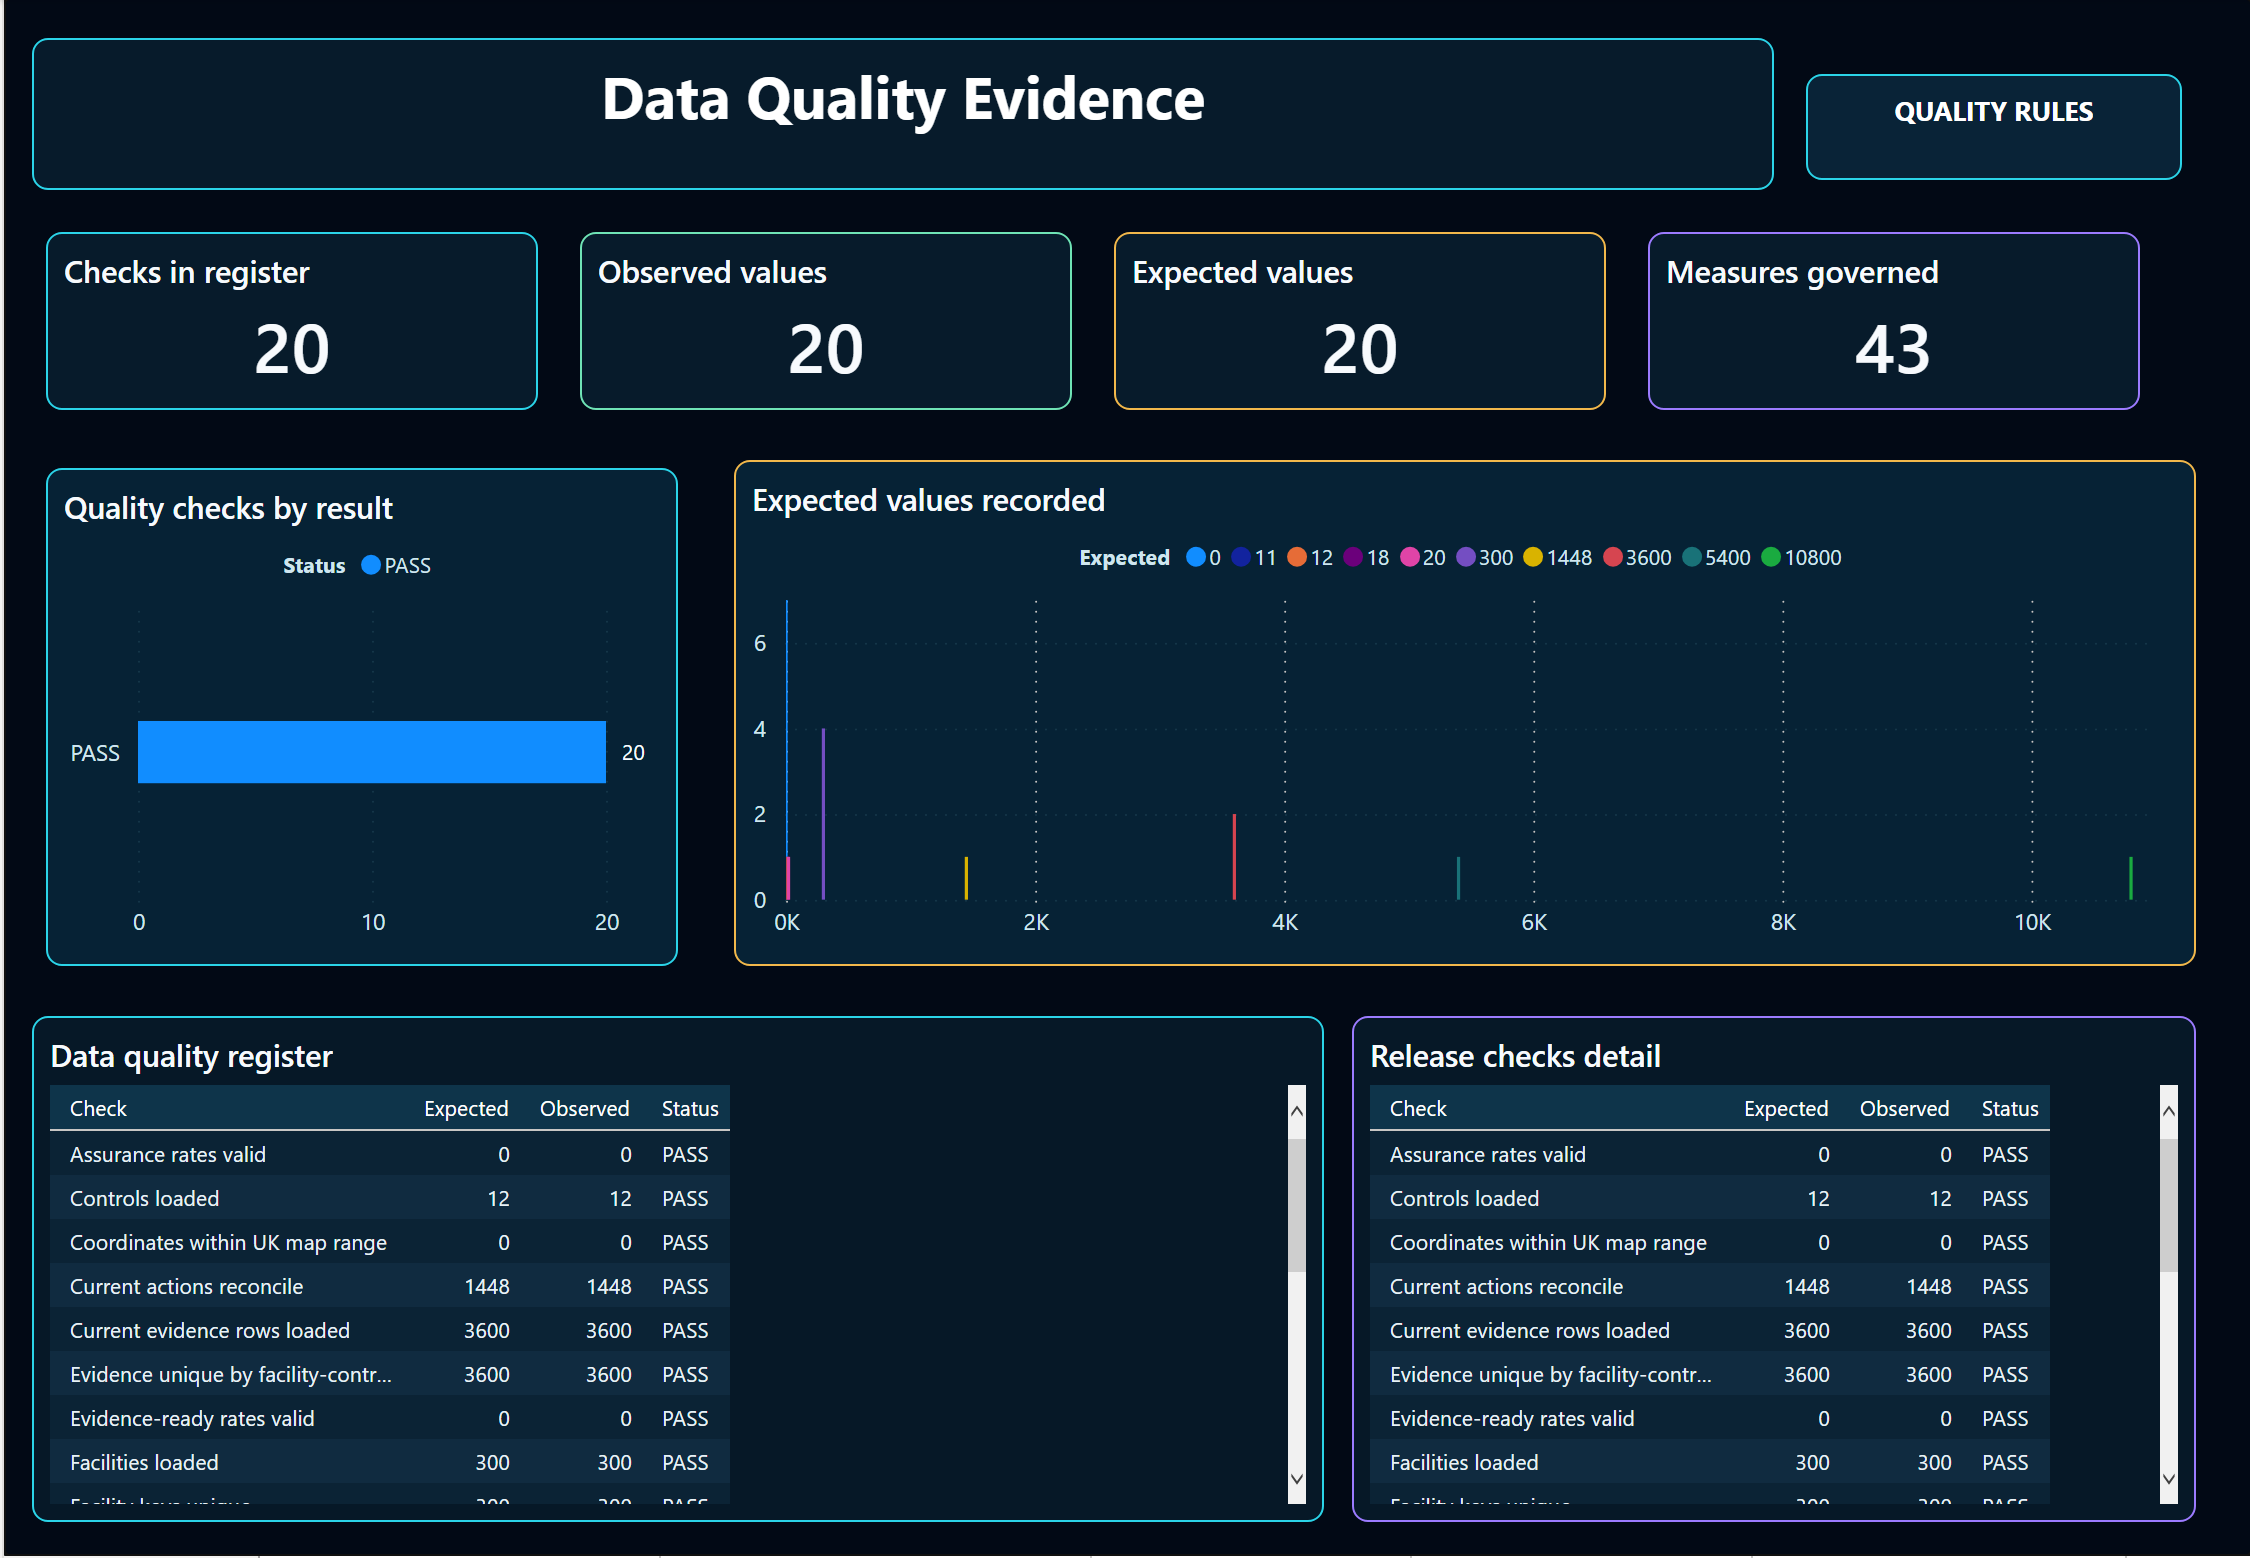
The report checks whether the expected data arrived, the measures are defined, the totals agree and outstanding actions have an owner.

The final pages bring the checks and responsibilities together so a reviewer can see what passed and what still needs attention before sign-off.

What the data highlights

  • All 20 checks pass in the example data.
  • The source population reconciles to 300 sites, 12 controls, 10,800 inspections and 3,600 evidence records.
  • Critical, high and medium priorities add up to the same 1,448 actions shown in the cause analysis.
  • Seven metric groups organise 43 measures across the report.

For a live implementation

  • Agree the reporting date, approver and ownership for unresolved checks, then refine the metric grouping and the chart that combines different units.
  • Confirm the live connection and refresh process, then test performance, permissions and accessibility in the target environment.
4 reports25 report pages249 report visuals

How the reports are built

A useful Power BI report connects the business question, the data and the calculation.

The report starts with the business question. Power Query prepares the records, the semantic model keeps the relationships clear and DAX applies the agreed calculations across every page.

  1. 01

    Define what the report needs to answer.

    Agree the main question, who will use the report and which detail they need to reach.

  2. 02

    Prepare and organise the data.

    Give each table a clear purpose, keep the relationships understandable and make the refresh repeatable.

  3. 03

    Agree and document the measures.

    Use explicit calculations so the same figure means the same thing on every report page.

  4. 04

    Check the figures and the user experience.

    Compare the headline with the underlying records, then review performance, navigation and accessibility for the intended users.

About the reports

What these examples show.

The screenshots demonstrate the report design, data model and analytical approach. A live implementation would be connected to the organisation’s data and tested in the environment where it will be used.

01

Inside the reports

Each report starts with a business question, explains the headline figures and provides a route to the supporting detail.

02

For a live implementation

The data connection, refresh schedule, access, ownership, performance and accessibility would be agreed and tested with the organisation.

03

About the editable files

The PBIX files are not available as public downloads. They may be shared separately after the data, metadata and distribution terms have been reviewed.

Behind the reports

Follow each report into its question, records and checks.

The viewer above is the quickest way to move through the report pages. The linked analysis explains the business question, the data, the calculations and the checks behind the report.

01

Project detail

A historical anonymised purchase order event log is used to find where items wait, which paths are uncommon, where work repeats and how payment blocks enter the process.

Open the purchase-to-pay analysis

Related services

Power BI may be the reporting layer, but the data preparation, measure definitions and monthly process still need to be clear and maintainable.

SolutionPower BI Solutions

Start with the question, model and data checks before deciding how the report should look.

CapabilityPower BI

Semantic modelling, Power Query, explicit DAX, report design, validation and maintainable handover.

Built by Quanta Meridian using public or purpose-made non-client data. No confidential or protected data is used.

Discuss a Power BI need

Tell us which measure, page or reporting process needs attention.

We can review how the result is calculated, where the current process becomes difficult to maintain and which parts of the report or model need to change.

Discuss a Power BI report